Maybe my mistake having forgotten that bus enumeration changes dynamically. I’ve now put an el cheapo SSD in the M.2 adapter to really identify the right ‘slot’ and lspci -nnvv shows x8 as LnkCap: https://0x0.st/88gw.txt
1 Like
I ordered one orion board. I know from my rock 5b that it lasts some time to get all developments done. Bot hopefully someone is is able to resolv the heatsink issue with the next software or acpi update. At least the board should work as a standard PC. Thanks to all making a standard user happy.
Regards
Just for my knowledge, what is the “heatsink issue” ? On mine, the fan speed can be adjusted using pwm, I’m setting it to silent enough mode this way:
$ echo 17 > /sys/class/hwmon/hwmon1/pwm1
1 Like
The noise.
Thanks I will test if I get my board.
Ah OK I understand then  On this one the fan can be completely stopped using pwm (though it wouldn’t be wise, as it gets warm). Also when it runs at low speed, the speed is quite regular so there’s no humming noise like we can have on some other devices. For example my LX2 sends a small boost every second, that’s unbearable, I had to dampen it using resistor+capacitor. No, really once booted, the O6 is quite bearable even for someone like me who can’t stand fans at all at less than 3m.
Quick build time comparisons between Rock 5B and Orion O6:
I’m building latest haproxy (which parallelizes build quite well). I’m avoiding the small cores, as at best they provide a 2-3% gain, but they add a lot of measurement noise depending on which large file ends on them. I’m avoiding the linker at the end (slow and single-threaded), and using the same compiler on both (gcc-9.3). Here’s what I’m seeing:
rock5b$ time taskset -c 4-7 make -j$(nproc) TARGET=linux-glibc USE_PCRE2=1 USE_OPENSSL=1 USE_PROMEX=1 USE_SLZ=1 USE_ZLIB= USE_NS=1 USE_QUIC=1 USE_QUIC_OPENSSL_COMPAT=1 CC=gcc-9 LD=true  haproxy
real    1m1.426s
user    3m49.425s
sys     0m14.982s

orion-o6$ time taskset -c 0,5-11 make -j$(nproc) TARGET=linux-glibc USE_PCRE2=1 USE_OPENSSL=1 USE_PROMEX=1 USE_SLZ=1 USE_ZLIB= USE_NS=1 USE_QUIC=1 USE_QUIC_OPENSSL_COMPAT=1 CC=gcc-9 LD=true  haproxy
real    0m18.860s
user    2m17.716s
sys     0m10.909s
Fairly reproducible. That’s a very acceptable 3.25x performance gain for twice the number of cores. This means a per-core gain of ~1.62 for a slightly higher frequency. If I rerun the same test on the middle cores (2.2 and 2.3 GHz), which are pretty much at the same frequency as the rock5b, I’m getting 38.00s, hence an 1.616x per-core gain at iso-frequency, which pretty much matches the above evaluation. That’s pretty honest IMHO.
2 Likes
Thanks for that, my ears are grateful.
When booting and when running off the Live CD, it seems the fan was at a low speed, but when I booted off NVMe it ramped up to 100% and stayed there even with the CPU reporting 30°C!
Separately, I’ll be posting my results as I get them in Radxa Orion O6 (Mini ITX) · Issue #62 · geerlingguy/sbc-reviews · GitHub
NOTE: I know this is not a released board yet, there will be many optimizations, etc. If I make a video about it prior to launch or blog about it, that will be in my disclaimers up front. But I still like to know how things are as a point of comparison. I won’t get quite into the weeds as much as some others here, but having a baseline for where certain benchmarks are today versus in a few months will (IMHO) be helpful.
1 Like
One other question, I’m seeing around 14W idle power draw using an Apple 61W USB-C PD wall charger, with an NVMe SSD, HDMI active, and a single Ethernet cable plugged in (2.5 Gbps). Does that match up to expectations? Too high? Too low?
Just wanted to compare to anyone else measuring total system power draw.
Nope. That’s nuts.
Let’s wait for China finishing celebrations
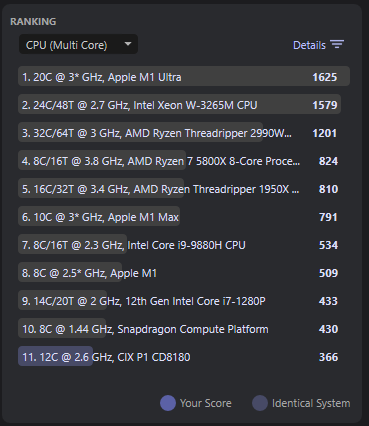
Indeed. Also if running HPL across all 12 CPU cores, I get an abysmal 36 Gflops at 36W… that’s in like RISC-V territory in terms of efficiency ![]()
Re-testing with 8 cores, but I think the default scheduling has something funky going on (and judging by a read-through of this issue, that seems to be what you’ve indicated as well.
I just tried shutting down my O6, with sudo shutdown now, but after shutting down, it booted right back up. It seems like pulling power is the only way to shut this down?
Maybe if I set AC Power Loss restore to not boot up the O6, it will work the way I expect?
Hello from Windows 11 ![]()
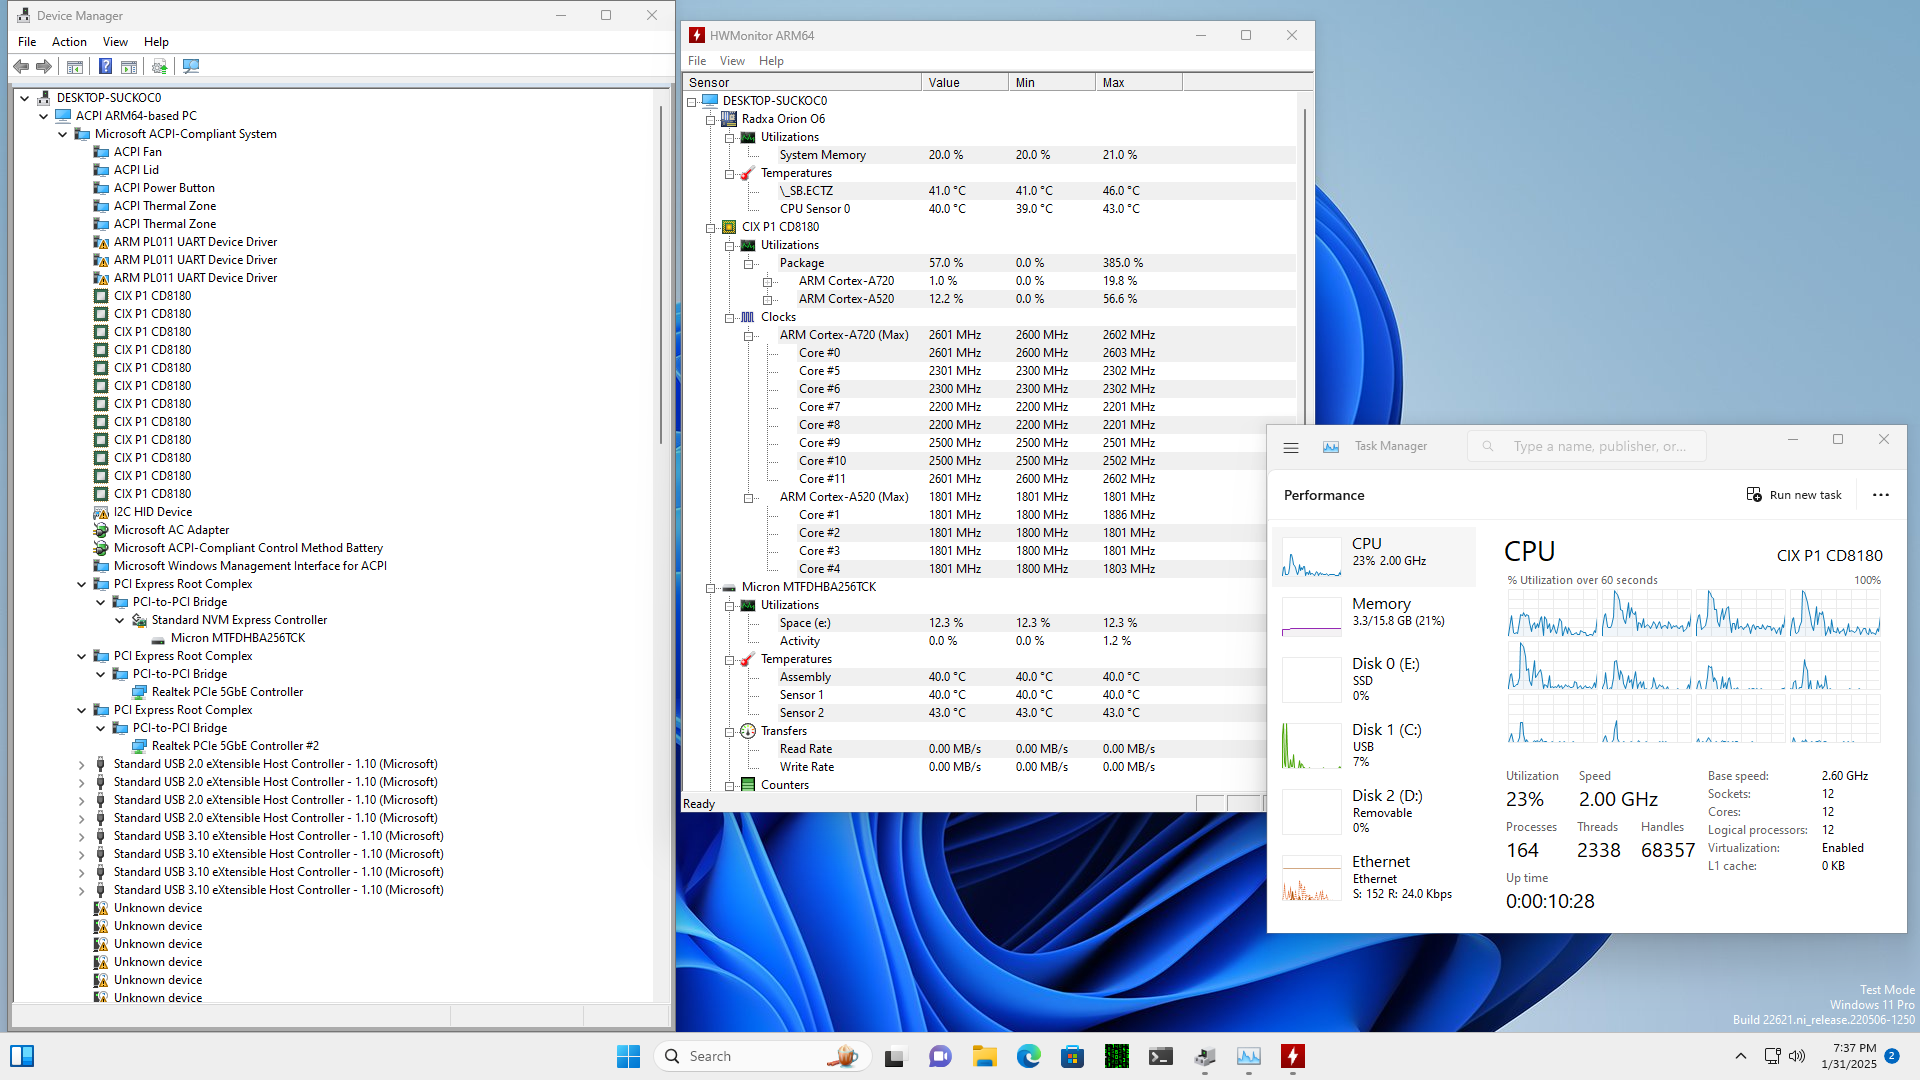
This is an older image of build 22621 I had lying around. Latest insider build 27783 only boots with a single core enabled, otherwise it bugchecks with PHASE0_EXCEPTION. Might investigate at some point.
Onboard Ethernet works with the driver here: coolstar/if_re-win: Open Source Realtek Ethernet Windows driver (Prod signed build: if_re_win_1.0.3.zip (163.7 KB)) - tested up to 1 Gbps.
The PCIe integration seems really well done, with compliant ECAM, cache coherence, ITS-based MSI(-X). As a result, things like NVME are usable out of the box.
Some early measurements:
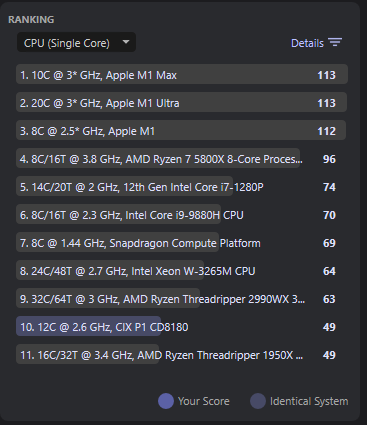
Geekbench 6.4.0
Radxa Computer (Shenzhen) Co., Ltd. Radxa Orion O6 - Geekbench (clocks from screenshot above)
Radxa Computer (Shenzhen) Co., Ltd. Radxa Orion O6 - Geekbench (1.8 GHz default for all clusters – ACPI CPPC doesn’t work yet so I had to raise the clocks manually)
Cinebench 2024.1.0
Note that newer builds have more Arm optimizations (e.g. ARMv8.1 atomics) and in theory could yield better results.
4 Likes
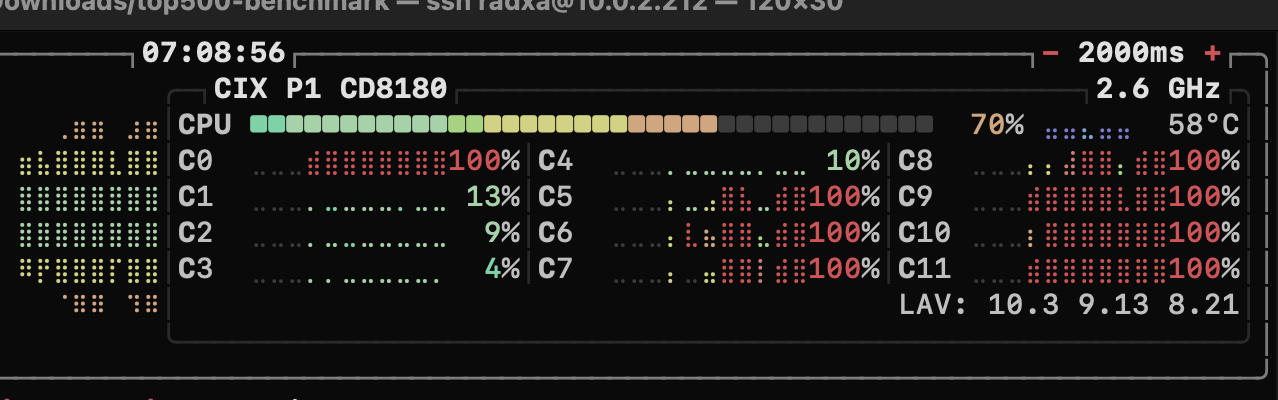
I think I’m having the start of an explanation for the slightly lower perf on CPU0:
$ watch -n 1 -d 'grep hda /proc/interrupts'
Every 1.0s: grep hda /proc/interrupts                                                                                                                                                      orion-o6: Sat Feb  1 21:17:58 2025

160:    6811576          0          0          0          0          0          0          0          0          0          0          0     PDCv1 234 Level     hda irq
This “hda” interrupt strikes at 50k per second on core 0. I’m now trying to figure what causes this. Unloading all snd_* modules crashed the system so I’ll need to blacklist them instead.
Edit: that was it. Here’s the new c2clat output after blacklisting all snd_* modules:
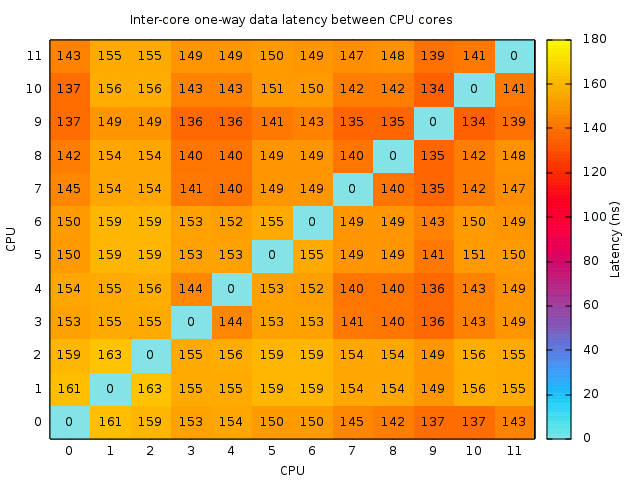
So now I think that core 0 is exactly the same as core 11, and once that driver is removed, there’s no reason not to use it for measurements.
2 Likes
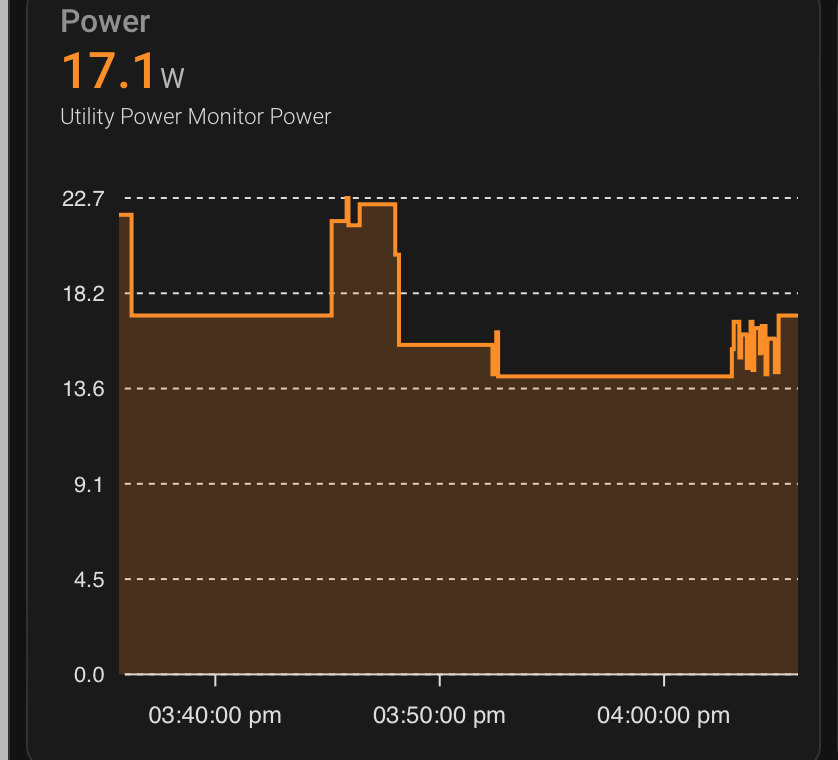
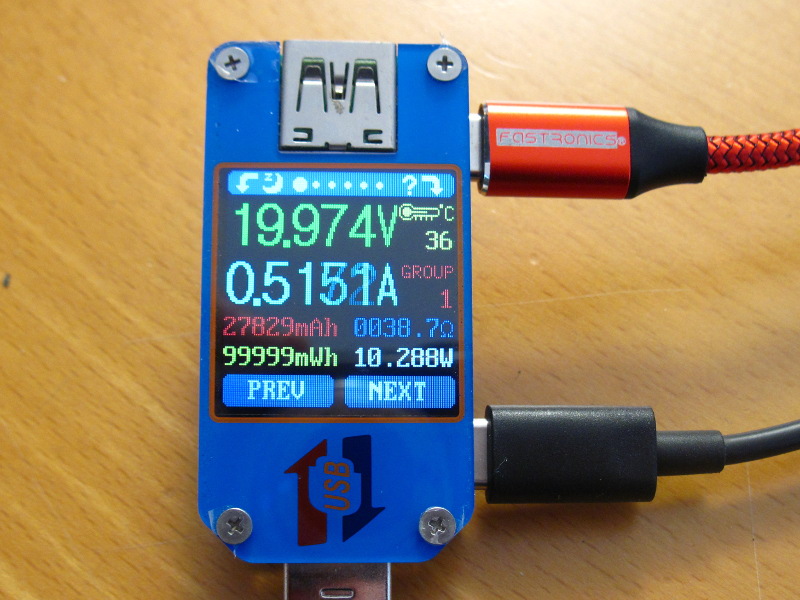
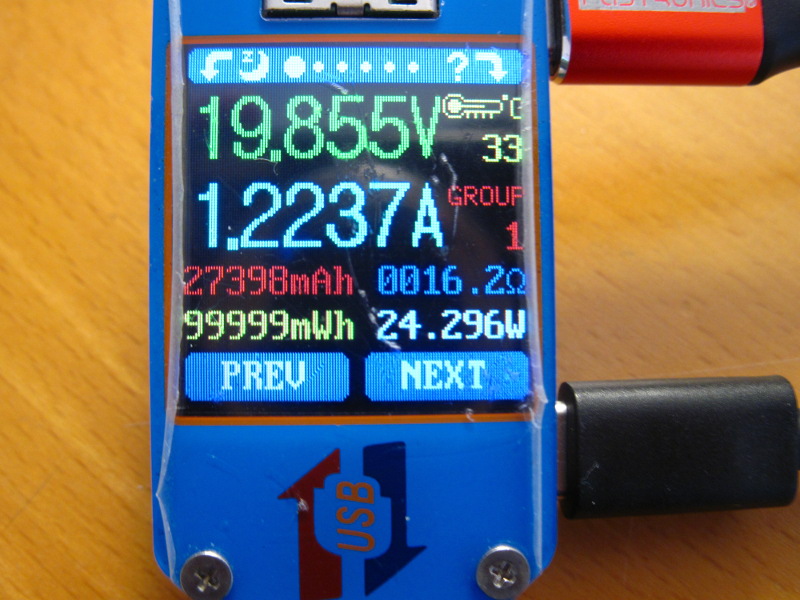
Jeff, I’m measuring the consumption with a USB adapter (that I verified was correct already). I’m getting 10.3-10.5W in idle (10.3 when cix_audio_switch is killed and snd_* removed). The RJ45 is connected to GbE, and I’m having a small 128G 2242 SSD. No HDMI. The highest I got was 24.3W when building haproxy on all cores, then 18.75W with “openssl speed -multi 12 rsa2048” on all cores, and 18.5W with multi 8 on the A720 (thus the A520 are quite cheap). It jumps from 10.3 to 14.2W when reading the SSD at 1.18GB/s. I’m seeing 22.6W under rambw. Min and max below:
4 Likes
I also tired a debian testing live iso with 6.10 kernel: https://cdimage.debian.org/cdimage/weekly-live-builds/arm64/iso-hybrid/
Debian’s 6.12 kernel in trixie or sid repo is not bootable.
The iso is built at August 2024, and the system will boot with an old date. I have to set datetime manually to make apt work. And I have to modify the grub install command in calamares at /usr/lib to make the installer run successfully.
2 Likes
I do wonder about Windows not properly detecting CPU caches on that version…
Also if the L3 cache is shared on all cores, benchmarks MIGHT score higher if the A520 cores are disabled. I feel like those cores are just a handbrake and a waste of L3 cache. Specially for Windows.
Core #10 was supposed to be core #0 and the MPIDRs reflect this. I wonder why they haven’t moved the whole cluster at least instead of placing a single A720 core before the A520 cluster.
Ah! I just discovered the same thing by looking at the DTB and at boot messages. In the DTB, we have:
- 4 A520 little cores
- 4 A720 medium cores
- 4 A720 big cores
But the kernel boots off CPU #10 which gets assigned logical CPU id 0. From there, all secondary CPUs are enumerated one at a time, explaining why we’re seeing the A520 from 1 to 5 etc. Then CPU10 is skipped since already used, and it finishes on CPU11 which is the only one at its correct place. This can be verified like this:
$ dmesg|grep '\(CPU\|processor\) 0x0000000'|cut -f2- -d','
cpu0,swapper]Booting Linux on physical CPU 0x0000000a00 [0x410fd811]
cpu1,swapper/1]CPU1: Booted secondary processor 0x0000000000 [0x410fd801]
cpu2,swapper/2]CPU2: Booted secondary processor 0x0000000100 [0x410fd801]
cpu3,swapper/3]CPU3: Booted secondary processor 0x0000000200 [0x410fd801]
cpu4,swapper/4]CPU4: Booted secondary processor 0x0000000300 [0x410fd801]
cpu5,swapper/5]CPU5: Booted secondary processor 0x0000000400 [0x410fd811]
cpu6,swapper/6]CPU6: Booted secondary processor 0x0000000500 [0x410fd811]
cpu7,swapper/7]CPU7: Booted secondary processor 0x0000000600 [0x410fd811]
cpu8,swapper/8]CPU8: Booted secondary processor 0x0000000700 [0x410fd811]
cpu9,swapper/9]CPU9: Booted secondary processor 0x0000000800 [0x410fd811]
cpu10,swapper/10]CPU10: Booted secondary processor 0x0000000900 [0x410fd811]
cpu11,swapper/11]CPU11: Booted secondary processor 0x0000000b00 [0x410fd811]
See these 0xa00 then 0x000, 0x100 … 0x900, then 0xb00. I think they should make the cores appear from biggest to smallest, and then they could boot off CPU0 without requiring any renumbering. I’ll experiment with the DTB to see if it could be sufficient to rearrange them there, though I doubt it.
1 Like
I’ve tried rearranging them in ACPI with Windows and it didn’t work. PSCI in TF-A relies on the current numbering…
Same here with the DTB. As soon as I change the order of the CPUs declared in the DTB, and just the declaration order, nothing else, it reboots during early boot. I also tried to adjust the core numbers/names etc in case it would matter. I’ve tried to adjust the “cpumap” section (has no effect). There’s also a “dsu” part that enumerates CPUs and even some cache_exception_core* but that didn’t fix it. It’s possible that the CPU numbers are hard-coded in some drivers that are not happy to see them changed.