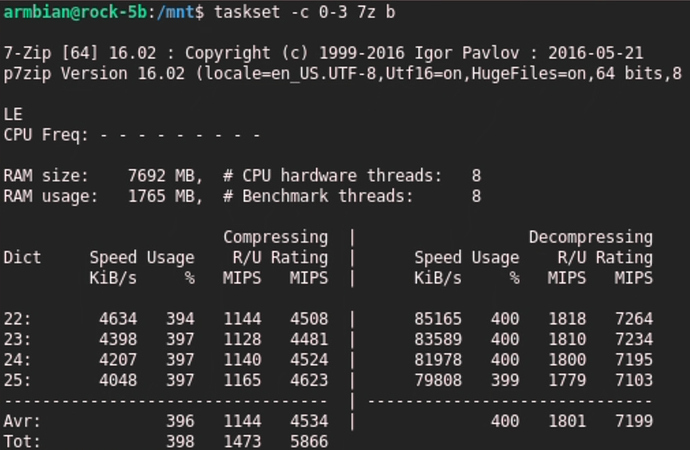
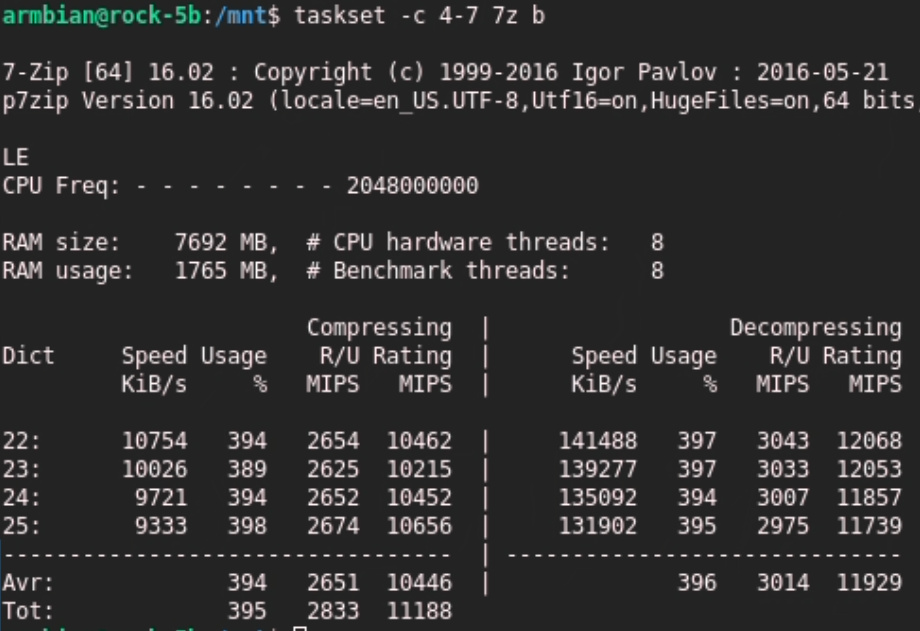
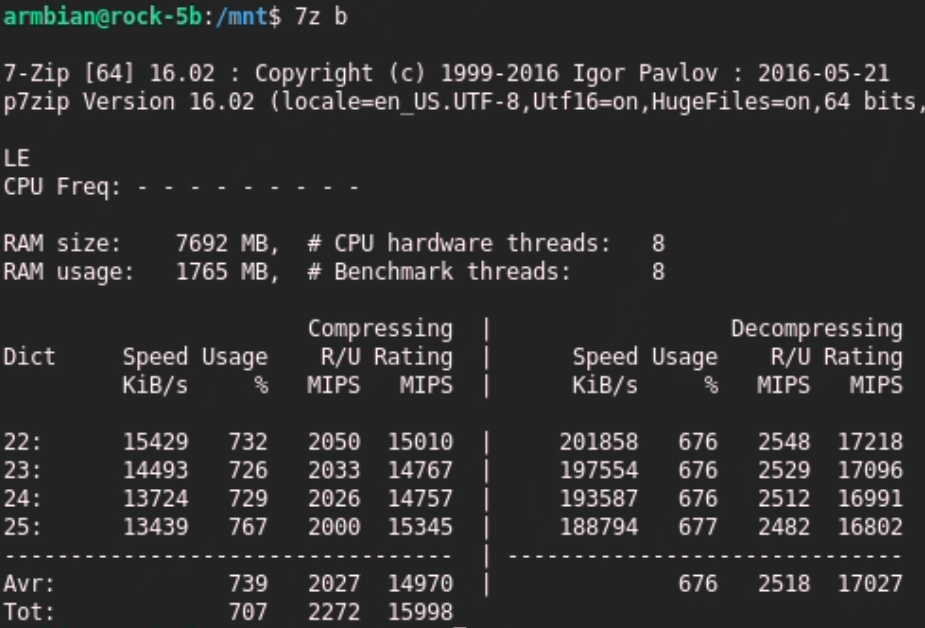
Hi all. I’ve gotten access to a Rock5b test board. I’ve done some quick benchmarks and made a video about it.
Interesting to see the great A76 performance.
Here it is, greetings. NicoD
Video : My first CPU benchmarks on the Rock5 in Linux
OMG, you still spread this insane BS at 5:50
While I already explained this to you multiple times another attempt:
What you’re seeing with 7-zip not utilizing all cores at 100% has nothing to do with ‘uneven performance’ or whatever else sick explanation you pulled from somewhere but with the task being bottlenecked by memory access.
The four A55 cores tested by sbc-bench at 1830 MHz:
RAM size:   15723 MB,  # CPU hardware threads:   8
RAM usage:    882 MB,  # Benchmark threads:      4

                       Compressing  |                  Decompressing
Dict     Speed Usage    R/U Rating  |      Speed Usage    R/U Rating
         KiB/s     %   MIPS   MIPS  |      KiB/s     %   MIPS   MIPS

22:       4384   346   1233   4265  |      86337   396   1859   7366
23:       4254   353   1229   4335  |      85544   399   1854   7402
24:       4267   364   1262   4589  |      83051   397   1838   7291
25:       4156   369   1284   4746  |      81616   399   1822   7264
----------------------------------  | ------------------------------
Avr:             358   1252   4484  |              398   1843   7331
Tot:             378   1548   5907
RAM size:    1958 MB,  # CPU hardware threads:   4
RAM usage:    882 MB,  # Benchmark threads:      4

                       Compressing  |                  Decompressing
Dict     Speed Usage    R/U Rating  |      Speed Usage    R/U Rating
         KiB/s     %   MIPS   MIPS  |      KiB/s     %   MIPS   MIPS

22:       2897   354    797   2818  |      82936   394   1797   7076
23:       2853   370    786   2907  |      80935   394   1777   7003
24:       2728   376    780   2933  |      78674   393   1756   6906
25:       2627   381    788   3000  |      76137   393   1723   6776
----------------------------------  | ------------------------------
Avr:             370    788   2915  |              394   1763   6940
Tot:             382   1275   4928
What can we see from these numbers? Memory access matters!
While the A55 in little RK3568 are clocked higher, the 7-ZIP score is lower and also CPU utilization is lower when decompressing: 99.5% on RK3588 and only 98.5% on RK3568.
According to your theory about ‘uneven performance’ (or whatever you called it in the past – you know why YouTube tech videos are crap? Since no text you could quickly search through! One must go through all the annoying babbling all the time!) you would expect 100%, right?
Quick check of sbc-bench’s results list [1] reveals the following CPU utilization for different SoCs when executing 7z b on all cores:
Even single core SoCs that feature a crappy memory controller are far away from reaching 100%, see Allwinner D1 for example. It has nothing to do with type of cores or ‘something uneven’ like you spread since years but with cores fighting over memory access!
So please stop spreading this BS! As well as wrong info about clockspeeds in this video when all you was reporting was cpufreq OPP and not clockspeeds (they need to be measured like sbc-bench is doing it).
BTW: if all you’re checking for is 100% CPU utilization then some lightweight joke like while true ; do yes >/dev/null; done on all cores is all that’s needed!
[1] just parsing the info everybody has at his hands since it happens in the open:
tk@mac-tk results % grep "SoC guess" *.txt | while read ; do
    SoCName="$(awk -F": " '{print $2}' <<<"${REPLY}")"
    ResultsFile=$(cut -f1 -d':' <<<"${REPLY}")
    echo "|  [${SoCName}](http://ix.io/$(basename ${ResultsFile} .txt)) | $(awk -F" " '/^Avr/ {print $2" | "$6}' "${ResultsFile}" | tail -n1) |"
doneUtilization divided by core count and also older sbc-bench results considered that missed SoC guessing:
Look at those SoCs/CPUs that are built for server tasks with 16 or even 2 x 48 cores. They can keep up with memory access since they’re designed for the task unlike cheap SoCs from the Android e-waste category!
4 x the same cores
400% usage in decompression what I only use.
Small difference in core sizes. 2.25 vs 2.3Ghz for cluster 2 and 3.
You see small difference in usage. 397%
When difference is larger you see a lower percentage.
All 8 cores and only 676% used of the 800%.
So my point is that using all core 7z b isn’t a reliable source. Better to do clusters seperate, or only single cores. That’s just my point.
Nice example of ignorance. Care to understand that there’s tons of examples above with ‘4 x the same cores’ that do not get a 400% decompression utilization for the simple reason that these SoCs originate from the Android e-waste world and chip internals are massively bottlenecking fully parallel operation of all cores.
Check ‘v0.9.8 Rockchip RK3188’, ‘v0.9.1 ASUS Tinker Board’ or the Amlogic S905 and RPi 4B results.
As such it’s the obvious result of adding more cores that CPU utilization further decreases since that stuff is too demanding. And actually CPU utilization is information – see the notes about ODROID XU4.
And why do you use only the decompression value? Which real-world use case is represented by this task?
Why the hell? Since you’re obsessed by 100% CPU utilization or is there another reason why you throw away useful information?
| SoC/device | compression | decompression |
|---|---|---|
| RK3188 | 325 | 377 |
| RK3288 | 354 | 399 |
| RK3288 | 332 | 387 |
| RK3288 | 310 | 385 |
| RK3288 | 284 | 386 |
| RK3288 | 302 | 386 |
| RK3288 | 353 | 397 |
| RK3288 | 323 | 395 |
| RK3288 | 335 | 396 |
| RK3288 | 359 | 381 |
| RK3288 | 358 | 381 |
| RK3288 | 364 | 381 |
| S905 | 320 | 397 |
| S905 | 310 | 393 |
| S905 | 310 | 393 |
| S905 | 321 | 394 |
| S905 | 312 | 377 |
| RPi 4B | 354 | 398 |
| RPi 4B | 351 | 396 |
| RPi 4B | 368 | 393 |
| RPi 4B | 353 | 392 |
| RPi 4B | 318 | 354 |
| RPi 4B | 339 | 387 |
| RPi 4B | 350 | 385 |
| RPi 4B | 315 | 375 |
| RPi 4B | 284 | 381 |
| RPi 4B | 364 | 395 |
| RPi 4B | 354 | 399 |
| RPi 4B | 362 | 388 |
| RPi 4B | 363 | 395 |
| RPi 4B | 357 | 397 |
| RPi 4B | 347 | 398 |
| RPi 4B | 365 | 393 |
| RPi 4B | 348 | 395 |
| RPi 4B | 357 | 397 |
| RPi 4B | 340 | 372 |
Don’t you agree that CPU utilization is actual information?
And keep in mind that these are all quad-core SoCs with same core types, no ‘different core types’ or ‘uneven performance’ BS.
When looking at RK3288 alone and checking also the kernel version (again, check the ODROID XU4 notes in sbc-bench documentation) then it should be obvious why CPU utilization is information:
| SoC/device | compression | decompression | kernel |
|---|---|---|---|
| RK3288 | 354 | 399 | 5.10 |
| RK3288 | 332 | 387 | 5.15 |
| RK3288 | 310 | 385 | 5.15 |
| RK3288 | 284 | 386 | 5.15 |
| RK3288 | 302 | 386 | 5.15 |
| RK3288 | 353 | 397 | 5.10 |
| RK3288 | 323 | 395 | 5.15 |
| RK3288 | 335 | 396 | 5.15 |
| RK3288 | 359 | 381 | 5.15 |
| RK3288 | 358 | 381 | 5.15 |
| RK3288 | 364 | 381 | 5.15 |
7-zip’s internal benchmark is such a cheap and effective way to do regression testing but people (like the Armbian folks) still just ignore it.
You are correct, memory bandwidth seems important here.
I don’t trow the info away, I often show it, but not this time.(not a hardware review video but CPU benchmark)
I prefer to use Blender for multi-core CPU benchmark, and 7zip for single core. But I still do the multi-core and keep the data.
My theory was that 7z b always gives equal tasks. So for 8-cores. 8 equal tasks for each core. When performing them, the big cores are finished before the small cores.
So I might be wrong and am not afraid to admit this.
No idea what that has to do with this discussion? It is a discussion between you and me, Armbian is not involved in me making this video or my benchmarks.
Thank you for sharing the information. Have a nice day.
Bandwidth? You know the difference between bandwidth and latency?
Why? Also why do you use only the 7-zip decompression score (already asked 5 days ago)?
Hey @NicoD
Few weeks later… do you now have a clue about basics? Or still just generating numbers without meaning?


