
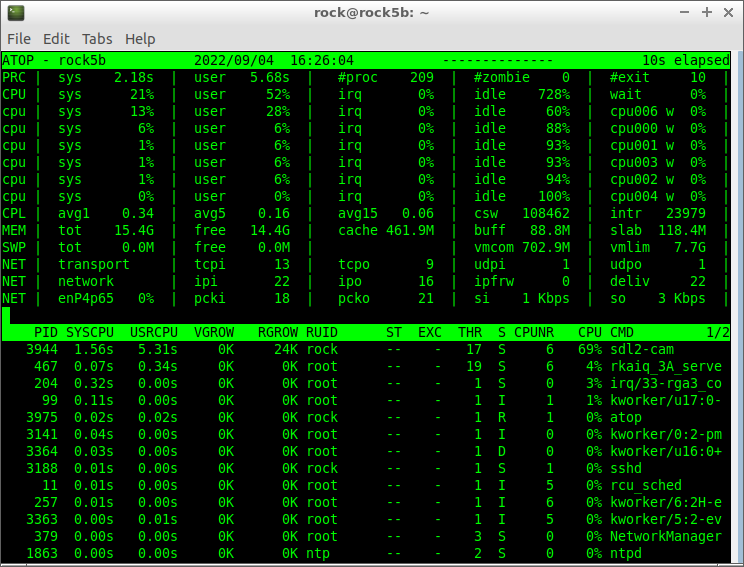
In this situation it seems one CPU core is maxing out with ksoftirqd while otherwise /proc/interrupts shows no IRQ bottleneck. Would still be interesting to verify with htop and atop whether there are bottlenecks (tasks/interrupts maxing out a little core) when running your tests. Since if that’s the case it’s time for IRQ affinity and SMP affinity moving that stuff over to the big cores.
ROCK 5B Debug Party Invitation
Finally, i now understand RkRgaBlit (2D engine) only works passing dma bufs.
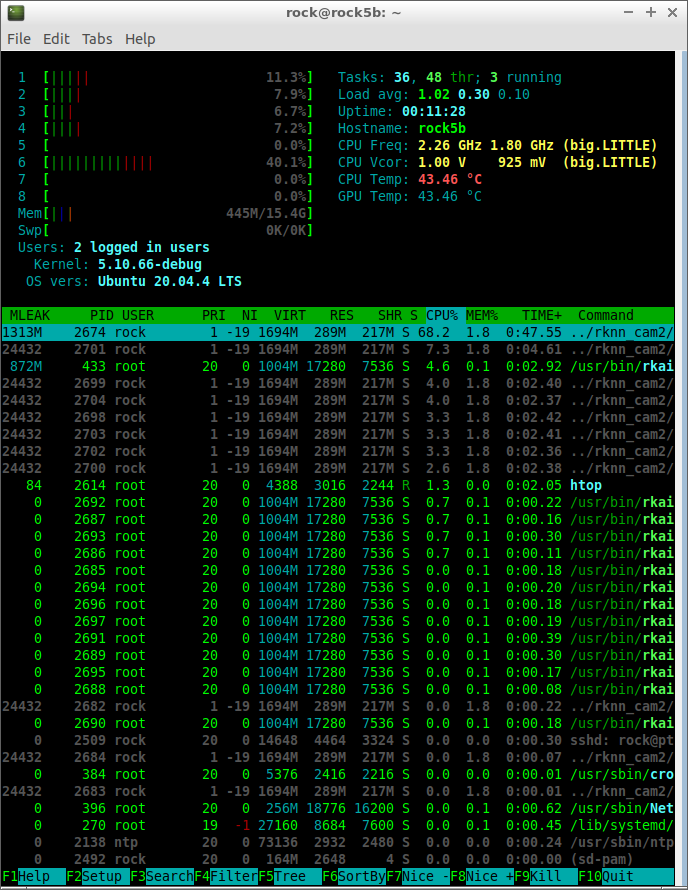
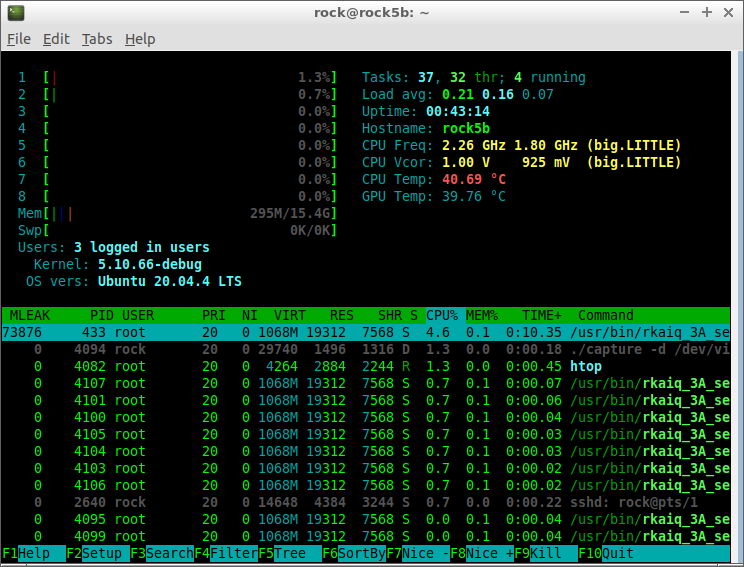
I was able to capture frames and render them with drm-fb. 1920x1080, 1.3% CPU.
Anyone wants to try Python on a GPU?
Patched kernel no longer required:
$ ./repl
Use CTRL-D to quit

MicroPython v1.19.1-298-gc616721b1 on 2022-09-08; Mali CSF with Arm Cortex-M7
Type "help()" for more information.
>>> def fib(i):
...     if i <= 2:
...         return 1
...     else:
...         return fib(i - 1) + fib(i - 2)
...
>>> fib(20)
6765
Not much works yet, but soon I should have the environment usable enough to write all of the firmware code in Python. Imagine the fun you’ll be able to have once you can mess about with GPU jobs and implement all the wallhacks you want, invisible to software!
(More seriously, it would be nice to have help with writing the firmware code.)
3 Likes
Nice
btw what is the status of panfrost on RK3588 ?
Is it working already?
It’s been working for a while… just not well enough that you’d actually want to use it.
I’m still trying to fully work out how the command stream interacts with the firmware, so that new GPU jobs can start as soon as the old one finishes, rather than the current implementation which just waits for an amount of time and hopes that’s enough.
As mali kernel driver is open source.
How mali drivers handle this?
Or it something you want to tune from (panfrost)user space?
Userspace has to interact directly with the firmware; the kernel only sets up the MMU and command queues so that CSF knows where to find instructions, as well as handling power management and the like.
(“CSF” is “Command Stream Frontend”, a term which covers multiple parts of the GPU, such as the command stream processor, the firmware, and “iterators” which submit jobs to the hardware.)
Thanks to @tkaiser’s image I could figure what was wrong with my dmc node not appearing. The system upgrade was performed with /boot unmounted, so the new kernel was installed in mmcblk1p2, leaving the origin one intact, which explains why I could see the node there but it wasn’t used at boot. However now apt/dpkg are angry and refuse to remove old kernels whatever the options I throw at them.
Anyway I could perform precise idle power measurements with cpu freq and dmc freq, with a watt meter connected on USB (however it interacts with PD so it’s running on 5V). I started with everything set to ondemand (thus at the lowest frequencies), then turned cluster0, then 4, then 6 to performance, then played with dmc freq and governor.
- base: 1.023 W
- cluster0 performance (1800 MHz): 1.075 W
- +cluster4 performance (2304 MHz): 1.128 W
- +cluster6 performance (2304 MHz): 1.168 W
- dmc performance (1068 MHz): 1.385 W
- dmc performance (1560 MHz): 1.546 W
- dmc performance (2112 MHz): 1.758 W
This gives me 590 mW when turning the dmc from 528 to 2112 MHz. The difference with Thomas’ measurements above can be explained by several factors:
- measurement on AC vs DC (always less accurate on DC)
- measurement including/excluding the PSU losses
- my board has 4 GB RAM so the measurement may also be affected by RAM consumption and not just the DMC’s. If that’s the case, it further makes sense to keep it in dynamic mode on boards with lots of memory.
…isn’t that big anyway. I measured (at the wall) first with an USB PD charger a 680mW difference between powersave and performance (dmc governor) and then rechecking with the ‘dumb’ RPi 15W USB-C power brick 630mW difference.
As such it’s save to assume that we’re talking about a difference of ~600mW at the device which might translate to more at the wall based on wattage/crappyness of the PSU used.
Yep and in this case the RAM size probably doesn’t count much.
I already thought about measuring how RAM size matters with full CPU load. The problem: many benchmarks do different things along the way and as such actual consumption will vary every second.
While my Netio powermeters could cope with this (letting them measure not actual consumption but cumulative consumption, then doing some math and use an averaged value over an hour or so) I guess it’s impossible with a wattmeter only showing actual (fluctuating) consumption. But maybe tasks like cpuminer benchmark or stress-ng generate a constant load pattern resulting in consistent consumption numbers?
If you’re in the mood and find something we could compare (trying to take the slight differences wrt PVTM/clockspeeds of our both RK3588 into account)
Actually I was more interested in measuring the idle consumption, because this is what we’re observing. Almost 2/3 of a watt when the machine does nothing is not negligible for some use cases, and I was a bit worried it could depend on the RAM size and result in 2.5W at 16 GB. Fortunately that doesn’t seem to be the case. However measuring the total energy at different frequencies is of course possible but it doesn’t make much sense: depending on who’s consuming the most between RAM and CPU, lower frequencies will vary from “consumes less” to “consumes more”. It’s the usual “race to idle” here, wasting energy in other devices while one is relaxing at low frequency. And I guess that for most workloads, slow RAM under load will only make things worse by increasing execution times. In my tests I noted that a single A76 core at full load easily consumes half a watt, hence roughly what RAM is saving at low frequency in idle state. If slow RAM increases processing time by 25% you’ve lost in CPU what you saved in RAM, and that sounds totally realistic for plenty of workloads.
Misunderstanding 
I wasn’t talking about measuring dmc governors under load but whether amount of RAM makes a difference under full load with ‘everything set to performance’.
I found a task that generates constant consumption. Out of the various memory related ‘stressors’ I found matrix and mergesort to be the most demanding.
root@rock-5b:~# stress-ng --class memory?
class 'memory' stressors: atomic bad-altstack bsearch context full heapsort hsearch judy lockbus lsearch malloc matrix matrix-3d mcontend membarrier memcpy memfd memrate memthrash mergesort mincore null numa oom-pipe pipe pipeherd qsort radixsort remap resources rmap shellsort skiplist stack stackmmap str stream tlb-shootdown tmpfs tree tsearch vm vm-addr vm-rw vm-segv wcs zero zlib
Looks like this then:
root@rock-5b:~# stress-ng --matrix 40 -a 8 -t 30s --times --perf --tz --metrics-brief
stress-ng: info:  [93934] dispatching hogs: 40 matrix
stress-ng: info:  [93934] successful run completed in 31.19s
stress-ng: info:  [93934] stressor       bogo ops real time  usr time  sys time   bogo ops/s   bogo ops/s
stress-ng: info:  [93934]                           (secs)    (secs)    (secs)   (real time) (usr+sys time)
stress-ng: info:  [93934] matrix           510828     30.04    239.35      0.00     17004.43      2134.23
stress-ng: info:  [93934] matrix:
stress-ng: info:  [93934]            392,959,712,240 CPU Cycles                     12.60 B/sec
stress-ng: info:  [93934]          1,524,398,343,320 Instructions                   48.87 B/sec (3.879 instr. per cycle)
stress-ng: info:  [93934]                 29,080,040 Branch Misses                   0.93 M/sec ( 0.00%)
stress-ng: info:  [93934]                884,472,720 Stalled Cycles Frontend        28.35 M/sec
stress-ng: info:  [93934]              8,069,127,080 Stalled Cycles Backend          0.26 B/sec
stress-ng: info:  [93934]            391,840,644,760 Bus Cycles                     12.56 B/sec
stress-ng: info:  [93934]            381,347,890,680 Cache References               12.23 B/sec
stress-ng: info:  [93934]              8,742,992,000 Cache Misses                    0.28 B/sec ( 2.29%)
stress-ng: info:  [93934]            383,239,260,960 Cache L1D Read                 12.29 B/sec
stress-ng: info:  [93934]              8,765,221,000 Cache L1D Read Miss             0.28 B/sec
stress-ng: info:  [93934]            385,273,837,200 Cache L1I Read                 12.35 B/sec
stress-ng: info:  [93934]                 35,591,680 Cache L1I Read Miss             1.14 M/sec
stress-ng: info:  [93934]                142,408,120 Cache LL Read                   4.57 M/sec
stress-ng: info:  [93934]                 92,725,760 Cache LL Read Miss              2.97 M/sec
stress-ng: info:  [93934]            383,236,328,480 Cache DTLB Read                12.29 B/sec
stress-ng: info:  [93934]                 21,827,520 Cache DTLB Read Miss            0.70 M/sec
stress-ng: info:  [93934]            380,102,621,720 Cache ITLB Read                12.19 B/sec
stress-ng: info:  [93934]                    281,640 Cache ITLB Read Miss            9.03 K/sec
stress-ng: info:  [93934]            193,641,586,920 Cache BPU Read                  6.21 B/sec
stress-ng: info:  [93934]                 24,352,560 Cache BPU Read Miss             0.78 M/sec
stress-ng: info:  [93934]            171,260,494,520 CPU Clock                       5.49 B/sec
stress-ng: info:  [93934]            171,323,867,600 Task Clock                      5.49 B/sec
stress-ng: info:  [93934]                        440 Page Faults Total              14.11 /sec
stress-ng: info:  [93934]                        440 Page Faults Minor              14.11 /sec
stress-ng: info:  [93934]                          0 Page Faults Major               0.00 /sec
stress-ng: info:  [93934]                     25,840 Context Switches              828.39 /sec
stress-ng: info:  [93934]                         80 CPU Migrations                  2.56 /sec
stress-ng: info:  [93934]                          0 Alignment Faults                0.00 /sec
stress-ng: info:  [93934]                          0 Emulation Faults                0.00 /sec
stress-ng: info:  [93934]                      4,560 System Call Enter             146.19 /sec
stress-ng: info:  [93934]                      4,520 System Call Exit              144.90 /sec
stress-ng: info:  [93934]                          0 Kmalloc                         0.00 /sec
stress-ng: info:  [93934]                          0 Kmalloc Node                    0.00 /sec
stress-ng: info:  [93934]                          0 Kfree                           0.00 /sec
stress-ng: info:  [93934]                        280 Kmem Cache Alloc                8.98 /sec
stress-ng: info:  [93934]                          0 Kmem Cache Alloc Node           0.00 /sec
stress-ng: info:  [93934]                        360 Kmem Cache Free                11.54 /sec
stress-ng: info:  [93934]                      2,320 MM Page Alloc                  74.38 /sec
stress-ng: info:  [93934]                      2,080 MM Page Free                   66.68 /sec
stress-ng: info:  [93934]                    155,200 RCU Utilization                 4.98 K/sec
stress-ng: info:  [93934]                        160 Sched Migrate Task              5.13 /sec
stress-ng: info:  [93934]                          0 Sched Move NUMA                 0.00 /sec
stress-ng: info:  [93934]                         40 Sched Wakeup                    1.28 /sec
stress-ng: info:  [93934]                          0 Sched Proc Exec                 0.00 /sec
stress-ng: info:  [93934]                          0 Sched Proc Exit                 0.00 /sec
stress-ng: info:  [93934]                          0 Sched Proc Fork                 0.00 /sec
stress-ng: info:  [93934]                          0 Sched Proc Free                 0.00 /sec
stress-ng: info:  [93934]                          0 Sched Proc Wait                 0.00 /sec
stress-ng: info:  [93934]                     25,840 Sched Switch                  828.39 /sec
stress-ng: info:  [93934]                          0 Signal Generate                 0.00 /sec
stress-ng: info:  [93934]                         40 Signal Deliver                  1.28 /sec
stress-ng: info:  [93934]                    110,280 IRQ Entry                       3.54 K/sec
stress-ng: info:  [93934]                    110,280 IRQ Exit                        3.54 K/sec
stress-ng: info:  [93934]                      3,800 Soft IRQ Entry                121.82 /sec
stress-ng: info:  [93934]                      3,800 Soft IRQ Exit                 121.82 /sec
stress-ng: info:  [93934]                          0 Writeback Dirty Inode           0.00 /sec
stress-ng: info:  [93934]                          0 Writeback Dirty Page            0.00 /sec
stress-ng: info:  [93934]                          0 Migrate MM Pages                0.00 /sec
stress-ng: info:  [93934]                          0 SKB Consume                     0.00 /sec
stress-ng: info:  [93934]                          0 SKB Kfree                       0.00 /sec
stress-ng: info:  [93934]                          0 IOMMU IO Page Fault             0.00 /sec
stress-ng: info:  [93934]                          0 IOMMU Map                       0.00 /sec
stress-ng: info:  [93934]                          0 IOMMU Unmap                     0.00 /sec
stress-ng: info:  [93934]                          0 Filemap page-cache add          0.00 /sec
stress-ng: info:  [93934]                          0 Filemap page-cache del          0.00 /sec
stress-ng: info:  [93934]                          0 OOM Wake Reaper                 0.00 /sec
stress-ng: info:  [93934]                          0 Thermal Zone Trip               0.00 /sec
stress-ng: info:  [93934] matrix:
stress-ng: info:  [93934]       center-thermal   61.67 C (334.82 K)
stress-ng: info:  [93934]          npu-thermal   62.51 C (335.66 K)
stress-ng: info:  [93934]     bigcore0-thermal   64.53 C (337.68 K)
stress-ng: info:  [93934]   littlecore-thermal   65.17 C (338.32 K)
stress-ng: info:  [93934]          gpu-thermal   64.30 C (337.45 K)
stress-ng: info:  [93934]          soc-thermal   64.68 C (337.83 K)
stress-ng: info:  [93934]     bigcore1-thermal   65.31 C (338.46 K)
stress-ng: info:  [93934] for a 31.19s run time:
stress-ng: info:  [93934]     249.54s available CPU time
stress-ng: info:  [93934]     239.58s user time   ( 96.01%)
stress-ng: info:  [93934]       0.13s system time (  0.05%)
stress-ng: info:  [93934]     239.71s total time  ( 96.06%)
stress-ng: info: [93934] load average: 15.76 8.86 14.73Would one of you fine folks with a sample be kind enough to run lat_mem_rd from lmbench on one of the A76 cores (something like ./lat_mem_rd -t -P 1 32mb)? It would be nice to see all three levels of the cache hierarchy in action
Here it comes:
$ taskset -c 4 /usr/lib/lmbench/bin/lat_mem_rd -t -P 1 32mb
"stride=64
0.00049 1.758
0.00098 1.758
0.00195 1.758
0.00293 1.758
0.00391 1.759
0.00586 1.758
0.00781 1.759
0.01172 1.759
0.01562 1.759
0.02344 1.759
0.03125 1.759
0.04688 3.330
0.06250 3.309
0.09375 4.724
0.12500 4.885
0.18750 5.391
0.25000 7.054
0.37500 8.261
0.50000 10.824
0.75000 15.403
1.00000 17.459
1.50000 18.799
2.00000 19.402
3.00000 35.180
4.00000 53.352
6.00000 81.463
8.00000 94.330
12.00000 106.829
16.00000 112.716
24.00000 118.363
32.00000 122.195
That’s pretty similar to what you’ll find in the various sbc-bench results which already include tinymembench and ramlat, e.g.:
$ taskset -c 4 ./ramspeed/ramlat -s -n 200 32768
   size:  1x32  2x32  1x64  2x64 1xPTR 2xPTR 4xPTR 8xPTR
     4k: 1.759 1.759 1.759 1.759 1.759 1.759 1.760 3.348
     8k: 1.759 1.759 1.759 1.759 1.759 1.759 1.760 3.429
    16k: 1.759 1.760 1.759 1.760 1.759 1.759 1.760 3.428
    32k: 1.759 1.760 1.759 1.760 1.759 1.760 1.760 3.432
    64k: 1.761 1.760 1.761 1.761 1.761 1.761 1.762 3.433
   128k: 5.282 5.282 5.280 5.282 5.280 5.856 7.401 13.33
   256k: 6.265 6.324 6.258 6.321 6.285 6.231 7.752 13.33
   512k: 8.965 8.217 8.657 8.223 8.839 8.597 9.808 15.91
  1024k: 18.71 18.59 18.63 18.58 18.21 18.79 20.64 30.93
  2048k: 19.84 19.91 19.56 19.89 19.59 20.32 22.37 32.47
  4096k: 60.64 44.72 53.68 44.35 52.51 45.79 48.30 62.13
  8192k: 103.7 87.83 100.8 87.44 99.57 86.48 86.50 94.74
 16384k: 122.1 114.0 120.8 112.3 121.2 110.7 112.3 112.2
 32768k: 131.9 129.9 130.7 129.6 131.5 124.7 122.3 126.9
Thanks @willy! This is exactly what I was after 
So it looks like core 4 in your sample runs at ~2.275GHz. Does that sound about right?
And it definitely has the max L2 config of 512KB and the cluster level L3 is 3MB (too bad it wasn’t 4MB, but it’s better than Rockchip going with 2MB ). Awesome!
120 - 130ns to memory is a whole lot better than many other Arm SoCs out there too (MT8183 sees just over 200ns).
Thanks again!
Quoting @willy: “Cores 4 and 5 are reported as running at 2286-2290 MHz while cores 6 and 7 are measured at 2308 MHz”.
Measured with his cool mhz utility.
sysfs contents from my sbc-bench result:
cpu0/index0: 32K, level: 1, type: Data
cpu0/index1: 32K, level: 1, type: Instruction
cpu0/index2: 128K, level: 2, type: Unified
cpu0/index3: 3072K, level: 3, type: Unified
cpu1/index0: 32K, level: 1, type: Data
cpu1/index1: 32K, level: 1, type: Instruction
cpu1/index2: 128K, level: 2, type: Unified
cpu1/index3: 3072K, level: 3, type: Unified
cpu2/index0: 32K, level: 1, type: Data
cpu2/index1: 32K, level: 1, type: Instruction
cpu2/index2: 128K, level: 2, type: Unified
cpu2/index3: 3072K, level: 3, type: Unified
cpu3/index0: 32K, level: 1, type: Data
cpu3/index1: 32K, level: 1, type: Instruction
cpu3/index2: 128K, level: 2, type: Unified
cpu3/index3: 3072K, level: 3, type: Unified
cpu4/index0: 64K, level: 1, type: Data
cpu4/index1: 64K, level: 1, type: Instruction
cpu4/index2: 512K, level: 2, type: Unified
cpu4/index3: 3072K, level: 3, type: Unified
cpu5/index0: 64K, level: 1, type: Data
cpu5/index1: 64K, level: 1, type: Instruction
cpu5/index2: 512K, level: 2, type: Unified
cpu5/index3: 3072K, level: 3, type: Unified
cpu6/index0: 64K, level: 1, type: Data
cpu6/index1: 64K, level: 1, type: Instruction
cpu6/index2: 512K, level: 2, type: Unified
cpu6/index3: 3072K, level: 3, type: Unified
cpu7/index0: 64K, level: 1, type: Data
cpu7/index1: 64K, level: 1, type: Instruction
cpu7/index2: 512K, level: 2, type: Unified
cpu7/index3: 3072K, level: 3, type: UnifiedYes, 120ns is one of the best results for ARM boards. My mcbin which used to be one of the best was at 175. RPi4 at 2 GHz gives me 154, and Odroid-N2+ at 2.4G says 135.