
Yep and in this case the RAM size probably doesn’t count much.
ROCK 5B Debug Party Invitation
I already thought about measuring how RAM size matters with full CPU load. The problem: many benchmarks do different things along the way and as such actual consumption will vary every second.
While my Netio powermeters could cope with this (letting them measure not actual consumption but cumulative consumption, then doing some math and use an averaged value over an hour or so) I guess it’s impossible with a wattmeter only showing actual (fluctuating) consumption. But maybe tasks like cpuminer benchmark or stress-ng generate a constant load pattern resulting in consistent consumption numbers?
If you’re in the mood and find something we could compare (trying to take the slight differences wrt PVTM/clockspeeds of our both RK3588 into account)
Actually I was more interested in measuring the idle consumption, because this is what we’re observing. Almost 2/3 of a watt when the machine does nothing is not negligible for some use cases, and I was a bit worried it could depend on the RAM size and result in 2.5W at 16 GB. Fortunately that doesn’t seem to be the case. However measuring the total energy at different frequencies is of course possible but it doesn’t make much sense: depending on who’s consuming the most between RAM and CPU, lower frequencies will vary from “consumes less” to “consumes more”. It’s the usual “race to idle” here, wasting energy in other devices while one is relaxing at low frequency. And I guess that for most workloads, slow RAM under load will only make things worse by increasing execution times. In my tests I noted that a single A76 core at full load easily consumes half a watt, hence roughly what RAM is saving at low frequency in idle state. If slow RAM increases processing time by 25% you’ve lost in CPU what you saved in RAM, and that sounds totally realistic for plenty of workloads.
Misunderstanding 
I wasn’t talking about measuring dmc governors under load but whether amount of RAM makes a difference under full load with ‘everything set to performance’.
I found a task that generates constant consumption. Out of the various memory related ‘stressors’ I found matrix and mergesort to be the most demanding.
root@rock-5b:~# stress-ng --class memory?
class 'memory' stressors: atomic bad-altstack bsearch context full heapsort hsearch judy lockbus lsearch malloc matrix matrix-3d mcontend membarrier memcpy memfd memrate memthrash mergesort mincore null numa oom-pipe pipe pipeherd qsort radixsort remap resources rmap shellsort skiplist stack stackmmap str stream tlb-shootdown tmpfs tree tsearch vm vm-addr vm-rw vm-segv wcs zero zlib
Looks like this then:
root@rock-5b:~# stress-ng --matrix 40 -a 8 -t 30s --times --perf --tz --metrics-brief
stress-ng: info:  [93934] dispatching hogs: 40 matrix
stress-ng: info:  [93934] successful run completed in 31.19s
stress-ng: info:  [93934] stressor       bogo ops real time  usr time  sys time   bogo ops/s   bogo ops/s
stress-ng: info:  [93934]                           (secs)    (secs)    (secs)   (real time) (usr+sys time)
stress-ng: info:  [93934] matrix           510828     30.04    239.35      0.00     17004.43      2134.23
stress-ng: info:  [93934] matrix:
stress-ng: info:  [93934]            392,959,712,240 CPU Cycles                     12.60 B/sec
stress-ng: info:  [93934]          1,524,398,343,320 Instructions                   48.87 B/sec (3.879 instr. per cycle)
stress-ng: info:  [93934]                 29,080,040 Branch Misses                   0.93 M/sec ( 0.00%)
stress-ng: info:  [93934]                884,472,720 Stalled Cycles Frontend        28.35 M/sec
stress-ng: info:  [93934]              8,069,127,080 Stalled Cycles Backend          0.26 B/sec
stress-ng: info:  [93934]            391,840,644,760 Bus Cycles                     12.56 B/sec
stress-ng: info:  [93934]            381,347,890,680 Cache References               12.23 B/sec
stress-ng: info:  [93934]              8,742,992,000 Cache Misses                    0.28 B/sec ( 2.29%)
stress-ng: info:  [93934]            383,239,260,960 Cache L1D Read                 12.29 B/sec
stress-ng: info:  [93934]              8,765,221,000 Cache L1D Read Miss             0.28 B/sec
stress-ng: info:  [93934]            385,273,837,200 Cache L1I Read                 12.35 B/sec
stress-ng: info:  [93934]                 35,591,680 Cache L1I Read Miss             1.14 M/sec
stress-ng: info:  [93934]                142,408,120 Cache LL Read                   4.57 M/sec
stress-ng: info:  [93934]                 92,725,760 Cache LL Read Miss              2.97 M/sec
stress-ng: info:  [93934]            383,236,328,480 Cache DTLB Read                12.29 B/sec
stress-ng: info:  [93934]                 21,827,520 Cache DTLB Read Miss            0.70 M/sec
stress-ng: info:  [93934]            380,102,621,720 Cache ITLB Read                12.19 B/sec
stress-ng: info:  [93934]                    281,640 Cache ITLB Read Miss            9.03 K/sec
stress-ng: info:  [93934]            193,641,586,920 Cache BPU Read                  6.21 B/sec
stress-ng: info:  [93934]                 24,352,560 Cache BPU Read Miss             0.78 M/sec
stress-ng: info:  [93934]            171,260,494,520 CPU Clock                       5.49 B/sec
stress-ng: info:  [93934]            171,323,867,600 Task Clock                      5.49 B/sec
stress-ng: info:  [93934]                        440 Page Faults Total              14.11 /sec
stress-ng: info:  [93934]                        440 Page Faults Minor              14.11 /sec
stress-ng: info:  [93934]                          0 Page Faults Major               0.00 /sec
stress-ng: info:  [93934]                     25,840 Context Switches              828.39 /sec
stress-ng: info:  [93934]                         80 CPU Migrations                  2.56 /sec
stress-ng: info:  [93934]                          0 Alignment Faults                0.00 /sec
stress-ng: info:  [93934]                          0 Emulation Faults                0.00 /sec
stress-ng: info:  [93934]                      4,560 System Call Enter             146.19 /sec
stress-ng: info:  [93934]                      4,520 System Call Exit              144.90 /sec
stress-ng: info:  [93934]                          0 Kmalloc                         0.00 /sec
stress-ng: info:  [93934]                          0 Kmalloc Node                    0.00 /sec
stress-ng: info:  [93934]                          0 Kfree                           0.00 /sec
stress-ng: info:  [93934]                        280 Kmem Cache Alloc                8.98 /sec
stress-ng: info:  [93934]                          0 Kmem Cache Alloc Node           0.00 /sec
stress-ng: info:  [93934]                        360 Kmem Cache Free                11.54 /sec
stress-ng: info:  [93934]                      2,320 MM Page Alloc                  74.38 /sec
stress-ng: info:  [93934]                      2,080 MM Page Free                   66.68 /sec
stress-ng: info:  [93934]                    155,200 RCU Utilization                 4.98 K/sec
stress-ng: info:  [93934]                        160 Sched Migrate Task              5.13 /sec
stress-ng: info:  [93934]                          0 Sched Move NUMA                 0.00 /sec
stress-ng: info:  [93934]                         40 Sched Wakeup                    1.28 /sec
stress-ng: info:  [93934]                          0 Sched Proc Exec                 0.00 /sec
stress-ng: info:  [93934]                          0 Sched Proc Exit                 0.00 /sec
stress-ng: info:  [93934]                          0 Sched Proc Fork                 0.00 /sec
stress-ng: info:  [93934]                          0 Sched Proc Free                 0.00 /sec
stress-ng: info:  [93934]                          0 Sched Proc Wait                 0.00 /sec
stress-ng: info:  [93934]                     25,840 Sched Switch                  828.39 /sec
stress-ng: info:  [93934]                          0 Signal Generate                 0.00 /sec
stress-ng: info:  [93934]                         40 Signal Deliver                  1.28 /sec
stress-ng: info:  [93934]                    110,280 IRQ Entry                       3.54 K/sec
stress-ng: info:  [93934]                    110,280 IRQ Exit                        3.54 K/sec
stress-ng: info:  [93934]                      3,800 Soft IRQ Entry                121.82 /sec
stress-ng: info:  [93934]                      3,800 Soft IRQ Exit                 121.82 /sec
stress-ng: info:  [93934]                          0 Writeback Dirty Inode           0.00 /sec
stress-ng: info:  [93934]                          0 Writeback Dirty Page            0.00 /sec
stress-ng: info:  [93934]                          0 Migrate MM Pages                0.00 /sec
stress-ng: info:  [93934]                          0 SKB Consume                     0.00 /sec
stress-ng: info:  [93934]                          0 SKB Kfree                       0.00 /sec
stress-ng: info:  [93934]                          0 IOMMU IO Page Fault             0.00 /sec
stress-ng: info:  [93934]                          0 IOMMU Map                       0.00 /sec
stress-ng: info:  [93934]                          0 IOMMU Unmap                     0.00 /sec
stress-ng: info:  [93934]                          0 Filemap page-cache add          0.00 /sec
stress-ng: info:  [93934]                          0 Filemap page-cache del          0.00 /sec
stress-ng: info:  [93934]                          0 OOM Wake Reaper                 0.00 /sec
stress-ng: info:  [93934]                          0 Thermal Zone Trip               0.00 /sec
stress-ng: info:  [93934] matrix:
stress-ng: info:  [93934]       center-thermal   61.67 C (334.82 K)
stress-ng: info:  [93934]          npu-thermal   62.51 C (335.66 K)
stress-ng: info:  [93934]     bigcore0-thermal   64.53 C (337.68 K)
stress-ng: info:  [93934]   littlecore-thermal   65.17 C (338.32 K)
stress-ng: info:  [93934]          gpu-thermal   64.30 C (337.45 K)
stress-ng: info:  [93934]          soc-thermal   64.68 C (337.83 K)
stress-ng: info:  [93934]     bigcore1-thermal   65.31 C (338.46 K)
stress-ng: info:  [93934] for a 31.19s run time:
stress-ng: info:  [93934]     249.54s available CPU time
stress-ng: info:  [93934]     239.58s user time   ( 96.01%)
stress-ng: info:  [93934]       0.13s system time (  0.05%)
stress-ng: info:  [93934]     239.71s total time  ( 96.06%)
stress-ng: info: [93934] load average: 15.76 8.86 14.73Would one of you fine folks with a sample be kind enough to run lat_mem_rd from lmbench on one of the A76 cores (something like ./lat_mem_rd -t -P 1 32mb)? It would be nice to see all three levels of the cache hierarchy in action
Here it comes:
$ taskset -c 4 /usr/lib/lmbench/bin/lat_mem_rd -t -P 1 32mb
"stride=64
0.00049 1.758
0.00098 1.758
0.00195 1.758
0.00293 1.758
0.00391 1.759
0.00586 1.758
0.00781 1.759
0.01172 1.759
0.01562 1.759
0.02344 1.759
0.03125 1.759
0.04688 3.330
0.06250 3.309
0.09375 4.724
0.12500 4.885
0.18750 5.391
0.25000 7.054
0.37500 8.261
0.50000 10.824
0.75000 15.403
1.00000 17.459
1.50000 18.799
2.00000 19.402
3.00000 35.180
4.00000 53.352
6.00000 81.463
8.00000 94.330
12.00000 106.829
16.00000 112.716
24.00000 118.363
32.00000 122.195
That’s pretty similar to what you’ll find in the various sbc-bench results which already include tinymembench and ramlat, e.g.:
$ taskset -c 4 ./ramspeed/ramlat -s -n 200 32768
   size:  1x32  2x32  1x64  2x64 1xPTR 2xPTR 4xPTR 8xPTR
     4k: 1.759 1.759 1.759 1.759 1.759 1.759 1.760 3.348
     8k: 1.759 1.759 1.759 1.759 1.759 1.759 1.760 3.429
    16k: 1.759 1.760 1.759 1.760 1.759 1.759 1.760 3.428
    32k: 1.759 1.760 1.759 1.760 1.759 1.760 1.760 3.432
    64k: 1.761 1.760 1.761 1.761 1.761 1.761 1.762 3.433
   128k: 5.282 5.282 5.280 5.282 5.280 5.856 7.401 13.33
   256k: 6.265 6.324 6.258 6.321 6.285 6.231 7.752 13.33
   512k: 8.965 8.217 8.657 8.223 8.839 8.597 9.808 15.91
  1024k: 18.71 18.59 18.63 18.58 18.21 18.79 20.64 30.93
  2048k: 19.84 19.91 19.56 19.89 19.59 20.32 22.37 32.47
  4096k: 60.64 44.72 53.68 44.35 52.51 45.79 48.30 62.13
  8192k: 103.7 87.83 100.8 87.44 99.57 86.48 86.50 94.74
 16384k: 122.1 114.0 120.8 112.3 121.2 110.7 112.3 112.2
 32768k: 131.9 129.9 130.7 129.6 131.5 124.7 122.3 126.9
Thanks @willy! This is exactly what I was after 
So it looks like core 4 in your sample runs at ~2.275GHz. Does that sound about right?
And it definitely has the max L2 config of 512KB and the cluster level L3 is 3MB (too bad it wasn’t 4MB, but it’s better than Rockchip going with 2MB ). Awesome!
120 - 130ns to memory is a whole lot better than many other Arm SoCs out there too (MT8183 sees just over 200ns).
Thanks again!
Quoting @willy: “Cores 4 and 5 are reported as running at 2286-2290 MHz while cores 6 and 7 are measured at 2308 MHz”.
Measured with his cool mhz utility.
sysfs contents from my sbc-bench result:
cpu0/index0: 32K, level: 1, type: Data
cpu0/index1: 32K, level: 1, type: Instruction
cpu0/index2: 128K, level: 2, type: Unified
cpu0/index3: 3072K, level: 3, type: Unified
cpu1/index0: 32K, level: 1, type: Data
cpu1/index1: 32K, level: 1, type: Instruction
cpu1/index2: 128K, level: 2, type: Unified
cpu1/index3: 3072K, level: 3, type: Unified
cpu2/index0: 32K, level: 1, type: Data
cpu2/index1: 32K, level: 1, type: Instruction
cpu2/index2: 128K, level: 2, type: Unified
cpu2/index3: 3072K, level: 3, type: Unified
cpu3/index0: 32K, level: 1, type: Data
cpu3/index1: 32K, level: 1, type: Instruction
cpu3/index2: 128K, level: 2, type: Unified
cpu3/index3: 3072K, level: 3, type: Unified
cpu4/index0: 64K, level: 1, type: Data
cpu4/index1: 64K, level: 1, type: Instruction
cpu4/index2: 512K, level: 2, type: Unified
cpu4/index3: 3072K, level: 3, type: Unified
cpu5/index0: 64K, level: 1, type: Data
cpu5/index1: 64K, level: 1, type: Instruction
cpu5/index2: 512K, level: 2, type: Unified
cpu5/index3: 3072K, level: 3, type: Unified
cpu6/index0: 64K, level: 1, type: Data
cpu6/index1: 64K, level: 1, type: Instruction
cpu6/index2: 512K, level: 2, type: Unified
cpu6/index3: 3072K, level: 3, type: Unified
cpu7/index0: 64K, level: 1, type: Data
cpu7/index1: 64K, level: 1, type: Instruction
cpu7/index2: 512K, level: 2, type: Unified
cpu7/index3: 3072K, level: 3, type: UnifiedYes, 120ns is one of the best results for ARM boards. My mcbin which used to be one of the best was at 175. RPi4 at 2 GHz gives me 154, and Odroid-N2+ at 2.4G says 135.
In my little sbc-bench results collection only Apple M1 Pro, Jetson AGX Orin, NXP LX2xx0A (Honeycomb LX2) and Qualcomm Snapdragon 865 (QRB5165) perform similar or better.
Yes I’m seeing 113ns on the LX2. This board has two 64-bit DDR4 channels, that must help a bit
As has been demonstrated 3 weeks ago after enabling dmc and defaulting to dmc_ondemand as governor by Radxa Rock5B’s idle consumption dropped by 500-600mW but also performance is harmed. See the Geekbench comparison above or compare sbc-bench scores. With dmc disabled or performance dmc governor performance is significantly higher than compared to dmc_ondemand.
Can this be changed? Of course.
There’s a few tunables below /sys/devices/platform/dmc/devfreq/dmc/ and upthreshold for example defaults to 40. This whole dmc thing (Dynamic Memory Interface) is all about clocking the RAM between 528 MHz and 2112 MHz based on ‘need’. But as we’ve seen defaults end up with RAM clocks not ramping up fast enough with benchmarks (and real-world tasks as well).
Quick loop with 7z b through 10-40 and listing the 7-ZIP MIPS for compression and decompression individually. Also measuring idle consumption for 3 minutes with each setting and reporting the averaged value:
upthreshold |
compression | decompression | idle |
|---|---|---|---|
| 40 | 12685 | 15492 | 1280mW |
| 30 | 15032 | 15111 | 1280mW |
| 20 | 14672 | 16297 | 1280mW |
| 10 | 15503 | 17252 | 1910mW |
| (performance) | 15370 | 17786 | 1920mW |
Looks like smart people (or smart distro maintainers) add this to some start script or service: echo 20 > /sys/devices/platform/dmc/devfreq/dmc/upthreshold
Full 7-zip MIPS list of all upthreshold values between 10 and 40:
| upthreshold | compression MIPS | decompression MIPS |
|---|---|---|
| 40 | 12685 | 15492 |
| 39 | 12327 | 15559 |
| 38 | 12349 | 15638 |
| 37 | 12356 | 15525 |
| 36 | 12362 | 15560 |
| 35 | 12183 | 15472 |
| 34 | 13809 | 15216 |
| 33 | 14373 | 15055 |
| 32 | 14978 | 14962 |
| 31 | 14658 | 15307 |
| 30 | 15032 | 15111 |
| 29 | 15127 | 14986 |
| 28 | 14960 | 14953 |
| 27 | 14888 | 15244 |
| 26 | 15190 | 15281 |
| 25 | 14727 | 15320 |
| 24 | 14819 | 15799 |
| 23 | 14710 | 14618 |
| 22 | 14847 | 16332 |
| 21 | 14964 | 16200 |
| 20 | 14672 | 16297 |
| 19 | 15125 | 16244 |
| 18 | 14972 | 16406 |
| 17 | 15373 | 16587 |
| 16 | 14985 | 16962 |
| 15 | 15372 | 17076 |
| 14 | 15403 | 17121 |
| 13 | 15282 | 17144 |
| 12 | 15139 | 17165 |
| 11 | 15185 | 17204 |
| 10 | 15503 | 17252 |
As can be seen each run needs to be repeated at least 5 times and then take an average value to get rid of result variation caused by side effects. But I’ll leave this for someone else as an excercise…
@hipboi to address the remaining performance problems (I/O performance with ondemand cpufreq governor and overall performance with dmc_ondemand memory governor) all that’s needed is adding some variables with values to a file below /etc/sysfs.d/. See at the very bottom here.
1 Like
@willy @tkaiser I have my board cpu cluster1 pvtm sel at 4 and cluster2 pvtm sel at 5. I added a patch to show some log printed from kernel:
--- a/drivers/opp/of.c

+++ b/drivers/opp/of.c

@@ -459,7 +459,7 @@ static bool _opp_is_supported(struct device *dev, struct opp_table *opp_table,

 	}


 	versions = count / levels;

-

+	dev_dbg(dev, "%s: count is %d, levels is %d, versions is %d\n", __func__, count, levels, versions);

 	/* All levels in at least one of the versions should match */

 	for (i = 0; i < versions; i++) {

 		bool supported = true;

@@ -475,6 +475,7 @@ static bool _opp_is_supported(struct device *dev, struct opp_table *opp_table,


 			/* Check if the level is supported */

 			if (!(val & opp_table->supported_hw[j])) {

+				dev_warn(dev, "%s: val is %u, opp_table->supported_hw[j] is %u", __func__, val, opp_table->supported_hw[j]);

 				supported = false;

 				break;

 			}

@@ -767,7 +768,7 @@ static struct dev_pm_opp *_opp_add_static_v2(struct opp_table *opp_table,


 	/* Check if the OPP supports hardware's hierarchy of versions or not */

 	if (!_opp_is_supported(dev, opp_table, np)) {

-		dev_dbg(dev, "OPP not supported by hardware: %lu\n",

+		dev_warn(dev, "OPP not supported by hardware: %lu\n",

 			new_opp->rate);

 		goto free_opp;

 	}
Here is the log I got:
[    3.958433] cpu cpu4: _opp_is_supported: val is 36, opp_table->supported_hw[j] is 16
[    3.958444] cpu cpu4: _opp_is_supported: val is 72, opp_table->supported_hw[j] is 16
[    3.958455] cpu cpu4: _opp_is_supported: val is 128, opp_table->supported_hw[j] is 16
[    3.959181] cpu cpu6: _opp_is_supported: val is 19, opp_table->supported_hw[j] is 32
[    3.960056] cpu cpu6: _opp_is_supported: val is 72, opp_table->supported_hw[j] is 32
[    3.960830] cpu cpu6: _opp_is_supported: val is 128, opp_table->supported_hw[j] is 32
The val value is deined in device tree opp-supported-hw. 19 is 0x13 from opp-2256000000, 36 is 0x24 from opp-2304000000, 72 is 0x48 from opp-2352000000, and 128 is 0x80 from opp-2400000000.
The kernel driver calculate the result of val & opp_table->supported_hw[j] to see if the opp rate is supported. It seems that 16=2^4, 32=2^5, and 4, 5 is the pvtm sel of that 2 clusters.
So if we change the opp-supported-hw of opp-2400000000, we may enable the 2.4GHz opp on the low pvtm boards. For example, use this patch:
diff --git a/arch/arm64/boot/dts/rockchip/rk3588s.dtsi b/arch/arm64/boot/dts/rockchip/rk3588s.dtsi

index bd88bc554..0471e960e 100644

--- a/arch/arm64/boot/dts/rockchip/rk3588s.dtsi

+++ b/arch/arm64/boot/dts/rockchip/rk3588s.dtsi

@@ -934,7 +934,7 @@

 			clock-latency-ns = <40000>;

 		};

 		opp-2400000000 {

-			opp-supported-hw = <0xff 0x80>;

+			opp-supported-hw = <0xff 0x10>;

 			opp-hz = /bits/ 64 <2400000000>;

 			opp-microvolt = <1000000 1000000 1000000>,

 					<1000000 1000000 1000000>;

@@ -1143,7 +1143,7 @@

 			clock-latency-ns = <40000>;

 		};

 		opp-2400000000 {

-			opp-supported-hw = <0xff 0x80>;

+			opp-supported-hw = <0xff 0x10>;

 			opp-hz = /bits/ 64 <2400000000>;

 			opp-microvolt = <1000000 1000000 1000000>,

 					<1000000 1000000 1000000>;
Nice findings! Three things come to my mind:
Me not qualified for testing due to my board allowing for the 2400 MHz cpufreq opp by default:
[    6.662048] cpu cpu4: pvtm=1785
[    6.665982] cpu cpu4: pvtm-volt-sel=7
[    6.673723] cpu cpu6: pvtm=1782
[    6.677675] cpu cpu6: pvtm-volt-sel=7
BTW: at least based on sbc-bench results collection my board is just one out of 21 that gets the 2400 MHz, the other 20 are limited to lower cpufreqs [1]. But as we’ve seen a lower cpufreq OPP can be compensated by the CPU cores clocking higher in reality. For example your board: cpu4-cpu5 get 2256 MHz as highest OPP but measured it’s ~2300 MHz.
Then I wonder whether these adjustment would be possible via a .dtbo as well?
And of course whether allowing higher cpufreqs without increasing supply voltage will not cause stability issues?
Back then when I was part of linux-sunxi community we used a special Linpack version for such testings since this benchmark was very sensitive to undervoltage. This way DVFS OPP for Allwinner A64 and H5 in mainline kernel were defined and I prepared some QA testing for Pinebook but to no avail (Pinebook owners not participating). At least the tools are here.
As a quick check all that should be needed is to install libmpich-dev, clone the repo, chdir inside and ./xhpl64.
[1] Filtered by SoC serial number these are results from 21 different RK3588/RK3588s:
| count of boards | A76 cpufreq OPP |
|---|---|
| 4 | 2256/2256 MHz |
| 5 | 2256/2304 MHz |
| 3 | 2304/2304 MHz |
| 1 | 2304/2352 MHz |
| 7 | 2352/2352 MHz |
| 1 | 2400/2400 MHz |
My board at home failed to reboot right now, so I will have further test after I get home. After verifying this patch I will provide a dts overlay.
In the early version of kernel code there is only clk 2.4GHz after 2.208GHz: https://github.com/Fruit-Pi/kernel/blob/develop-5.10/arch/arm64/boot/dts/rockchip/rk3588s.dtsi#L850. So there maybe some reason causing rk add more limit to the clk. So it’s better that @jack @hipboi can ask rockchip why the cpu clk is set to the current status.
Interesting to compare with most recent rk3588s.dtsi and the DVFS definitions there. Between 1416-2016 MHz the supply voltage is 25mV higher these days, 2208 MHz get an additional 12.5mV but everything exceeding 2208 MHz is fed with 1000mV just like the 2400 OPP from back then (again +12.5mV above the 2208 OPP).
Usually the highest DVFS OPP get a massive boost in supply voltage compared to the lower clocking ones. Strange!
1 Like
And it’s the same with RK3588 as well. Walking through all DVFS OPP between 408 and 2400 MHz with all four A76 the usual picture: 7-ZIP scores scale linearly while consumption/temperature rise the more the higher the clockspeed:
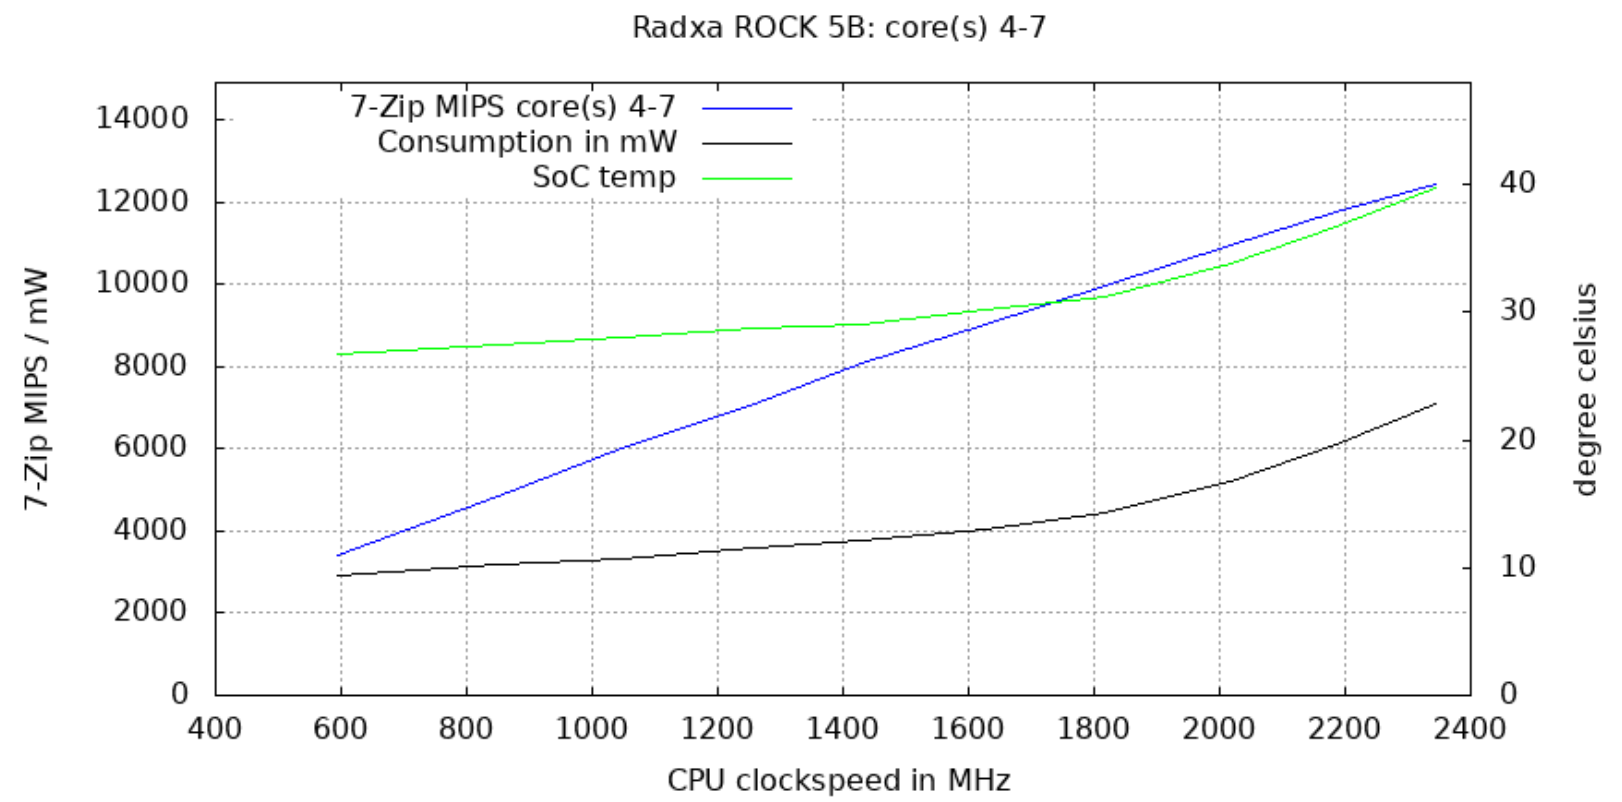
| MHz OPP / measured | 7-ZIP MIPS | Temp | consumption |
|---|---|---|---|
| 408 / 400 | 2320 | 25.9°C | 2673mW |
| 600 / 600 | 3423 | 26.8°C | 2913mW |
| 816 / 860 | 4843 | 27.5°C | 3200mW |
| 1008 / 1050 | 5995 | 28.1°C | 3336mW |
| 1200 / 1260 | 7083 | 28.7°C | 3586mW |
| 1416 / 1430 | 8062 | 29.0°C | 3780mW |
| 1608 / 1630 | 9030 | 30.2°C | 4036mW |
| 1800 / 1820 | 9960 | 31.2°C | 4450mW |
| 2016 / 2020 | 10943 | 33.9°C | 5183mW |
| 2208 / 2190 | 11733 | 36.7°C | 6106mW |
| 2400 / 2350 | 12412 | 39.8°C | 7096mW |
1 Like
I tested the new dts, opp clk 2.4GHz is unlocked, but the real frequency is still lower: http://ix.io/4bBY. Maybe a higher volt is still needed.
Here is the dts overlay:
/dts-v1/;
/plugin/;
/ {
	fragment@0 {
		target = <&cluster1_opp_table>;
		__overlay__ {
			opp-2400000000 {
				opp-supported-hw = <0xff 0xf0>;
			};
		};
	};
	fragment@1 {
		target = <&cluster2_opp_table>;
		__overlay__ {
			opp-2400000000 {
				opp-supported-hw = <0xff 0xf0>;
			};
		};
	};
};