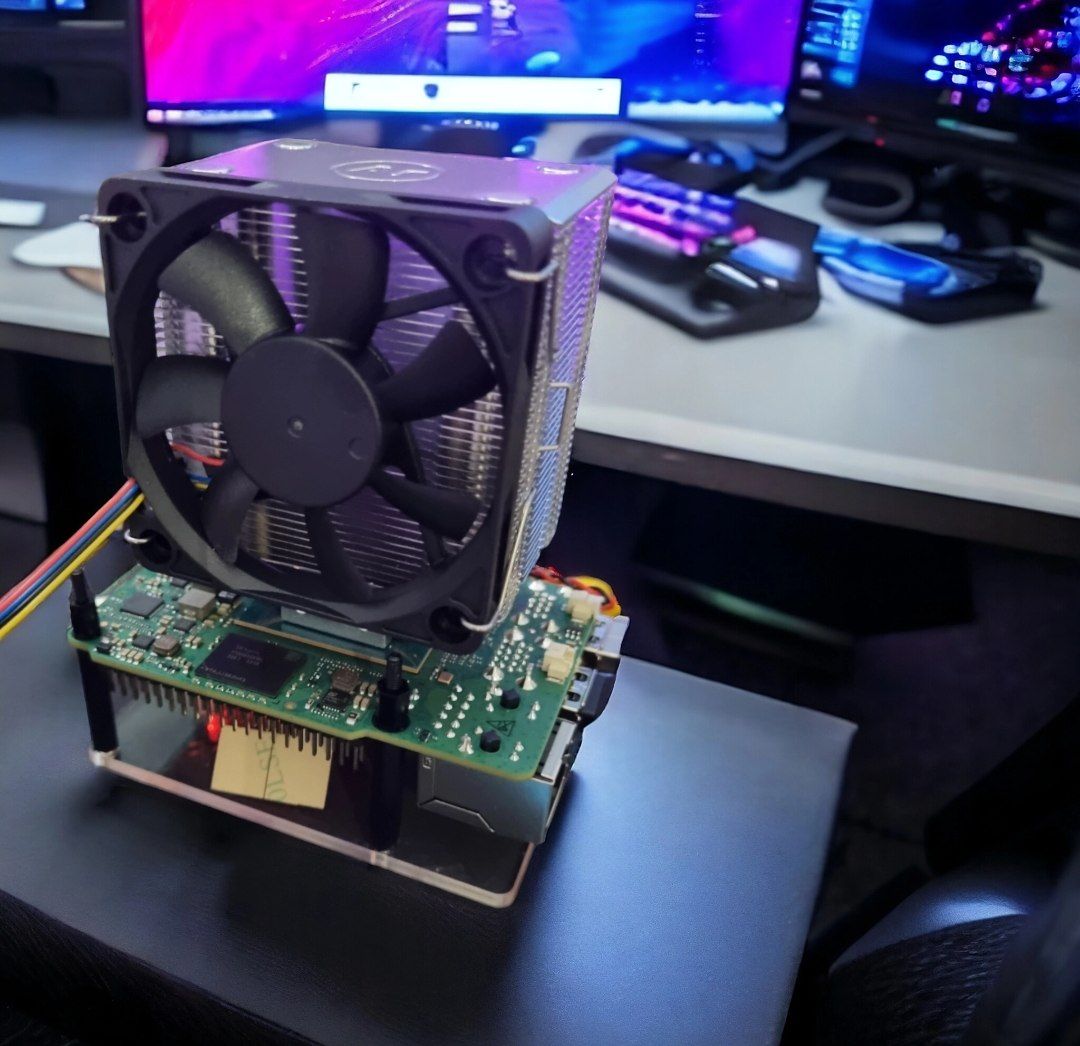
I have read a few guides and it seems the board suffers from high temperatures meaning that the current case/fan options dont do its justice. I feel this is crtitic.. Do you guys have been trough the same ? Will there be an solution?
Guess this was the wildest ive seen.
opened 03:09AM - 20 Jul 24 UTC
testing complete

## Basic information
- Board URL (official): https://radxa.com/products/x/x4 ([docs](https://docs.radxa.com/en/x/x4))
- Board purchased from: Arace
- Board purchase date: July 19, 2024
- Board specs (as tested): 8GB
- Board price (as tested): $79.90 (+ $14.90 heatsink+fan)
## Linux/system information
```
# output of `screenfetch`
./+o+- jgeerling@radxa-x4
yyyyy- -yyyyyy+ OS: Ubuntu 24.04 noble
://+//////-yyyyyyo Kernel: x86_64 Linux 6.8.0-39-generic
.++ .:/++++++/-.+sss/` Uptime: 3m
.:++o: /++++++++/:--:/- Packages: 1594
o:+o+:++.`..```.-/oo+++++/ Shell: bash 5.2.21
.:+o:+o/. `+sssoo+/ Disk: 9.3G / 938G (2%)
.++/+:+oo+o:` /sssooo. CPU: Intel N100 @ 4x 3.4GHz [49.0°C]
/+++//+:`oo+o /::--:. GPU: UHD Graphics
\+/+o+++`o++o ++////. RAM: 1399MiB / 7716MiB
.++.o+++oo+:` /dddhhh.
.+.o+oo:. `oddhhhh+
\+.++o+o``-````.:ohdhhhhh+
`:o+++ `ohhhhhhhhyo++os:
.o:`.syhhhhhhh/.oo++o`
/osyyyyyyo++ooo+++/
````` +oo+++o\:
`oo++.
# output of `uname -a`
Linux radxa-x4 6.8.0-39-generic #39-Ubuntu SMP PREEMPT_DYNAMIC Fri Jul 5 21:49:14 UTC 2024 x86_64 x86_64 x86_64 GNU/Linux
```
## Benchmark results
### CPU
- Geekbench 6: (1185 single / 2658 multi - https://browser.geekbench.com/v6/cpu/7127802)
- 37.224 Gflops at 2.33 Gflops/W ([geerlingguy/top500-benchmark](https://github.com/geerlingguy/top500-benchmark) [HPL result](https://github.com/geerlingguy/top500-benchmark/issues/38))
### Power
- Idle power draw (at wall): 9.1 W
- Maximum simulated power draw (`stress-ng --matrix 0`): 18.5 W
- During Geekbench multicore benchmark: 21.2 W
- During `top500` HPL benchmark: 16 W
### Disk
#### Kioxia BG6 2230 1TB NVMe SSD (KBG40ZNS1T02)
[comment]: # (Run `lsblk -o NAME,FSTYPE,LABEL,MOUNTPOINT,SIZE,MODEL` to get model)
| Benchmark | Result |
| -------------------------- | ------ |
| iozone 4K random read | 60.17 MB/s |
| iozone 4K random write | 227.78 MB/s |
| iozone 1M random read | 1679.58 MB/s |
| iozone 1M random write | 1506.50 MB/s |
| iozone 1M sequential read | 1701.32 MB/s |
| iozone 1M sequential write | 1527.16 MB/s |
```
wget https://raw.githubusercontent.com/geerlingguy/pi-cluster/master/benchmarks/disk-benchmark.sh
chmod +x disk-benchmark.sh
sudo MOUNT_PATH=/ TEST_SIZE=1g ./disk-benchmark.sh
```
Run benchmark on any attached storage device (e.g. eMMC, microSD, NVMe, SATA) and add results under an additional heading.
Also consider running [PiBenchmarks.com script](https://www.jeffgeerling.com/blog/2023/using-pibenchmarkscom-sbc-disk-performance-testing).
### Network
`iperf3` results:
#### Built-in 2.5 Gbps Ethernet (Intel I226-V)
- `iperf3 -c $SERVER_IP`: 2.35 Gbps
- `iperf3 -c $SERVER_IP --reverse`: 1.77 Gbps
- `iperf3 -c $SERVER_IP --bidir`: 2.34 Gbps up, 1.77 Gbps down
#### Built-in Realtek WiFi 6 (RTL8852BE)
- `iperf3 -c $SERVER_IP`: 651 Mbps
- `iperf3 -c $SERVER_IP --reverse`: 319 Mbps
- `iperf3 -c $SERVER_IP --bidir`: 596 Mbps up, 88 Mbps down
## GPU
`glmark2-es2` results:
```
=======================================================
glmark2 2023.01
=======================================================
OpenGL Information
GL_VENDOR: Intel
GL_RENDERER: Mesa Intel(R) Graphics (ADL-N)
GL_VERSION: OpenGL ES 3.2 Mesa 24.0.9-0ubuntu0.1
Surface Config: buf=32 r=8 g=8 b=8 a=8 depth=24 stencil=0 samples=0
Surface Size: 800x600 windowed
=======================================================
[build] use-vbo=false: FPS: 2512 FrameTime: 0.398 ms
[build] use-vbo=true: FPS: 2623 FrameTime: 0.381 ms
[texture] texture-filter=nearest: FPS: 2532 FrameTime: 0.395 ms
[texture] texture-filter=linear: FPS: 2495 FrameTime: 0.401 ms
[texture] texture-filter=mipmap: FPS: 2507 FrameTime: 0.399 ms
[shading] shading=gouraud: FPS: 1958 FrameTime: 0.511 ms
[shading] shading=blinn-phong-inf: FPS: 1939 FrameTime: 0.516 ms
[shading] shading=phong: FPS: 3638 FrameTime: 0.275 ms
[shading] shading=cel: FPS: 3646 FrameTime: 0.274 ms
[bump] bump-render=high-poly: FPS: 2344 FrameTime: 0.427 ms
[bump] bump-render=normals: FPS: 4118 FrameTime: 0.243 ms
[bump] bump-render=height: FPS: 2491 FrameTime: 0.402 ms
[effect2d] kernel=0,1,0;1,-4,1;0,1,0;: FPS: 2842 FrameTime: 0.352 ms
[effect2d] kernel=1,1,1,1,1;1,1,1,1,1;1,1,1,1,1;: FPS: 1348 FrameTime: 0.742 ms
[pulsar] light=false:quads=5:texture=false: FPS: 4415 FrameTime: 0.227 ms
[desktop] blur-radius=5:effect=blur:passes=1:separable=true:windows=4: FPS: 1216 FrameTime: 0.823 ms
[desktop] effect=shadow:windows=4: FPS: 2335 FrameTime: 0.428 ms
[buffer] columns=200:interleave=false:update-dispersion=0.9:update-fraction=0.5:update-method=map: FPS: 655 FrameTime: 1.528 ms
[buffer] columns=200:interleave=false:update-dispersion=0.9:update-fraction=0.5:update-method=subdata: FPS: 1187 FrameTime: 0.843 ms
[buffer] columns=200:interleave=true:update-dispersion=0.9:update-fraction=0.5:update-method=map: FPS: 621 FrameTime: 1.610 ms
[ideas] speed=duration: FPS: 2410 FrameTime: 0.415 ms
[jellyfish] <default>: FPS: 2134 FrameTime: 0.469 ms
[terrain] <default>: FPS: 204 FrameTime: 4.914 ms
[shadow] <default>: FPS: 3225 FrameTime: 0.310 ms
[refract] <default>: FPS: 508 FrameTime: 1.969 ms
[conditionals] fragment-steps=0:vertex-steps=0: FPS: 3842 FrameTime: 0.260 ms
[conditionals] fragment-steps=5:vertex-steps=0: FPS: 3708 FrameTime: 0.270 ms
[conditionals] fragment-steps=0:vertex-steps=5: FPS: 3697 FrameTime: 0.271 ms
[function] fragment-complexity=low:fragment-steps=5: FPS: 3447 FrameTime: 0.290 ms
[function] fragment-complexity=medium:fragment-steps=5: FPS: 3307 FrameTime: 0.302 ms
[loop] fragment-loop=false:fragment-steps=5:vertex-steps=5: FPS: 3047 FrameTime: 0.328 ms
[loop] fragment-steps=5:fragment-uniform=false:vertex-steps=5: FPS: 3273 FrameTime: 0.306 ms
[loop] fragment-steps=5:fragment-uniform=true:vertex-steps=5: FPS: 3566 FrameTime: 0.280 ms
=======================================================
glmark2 Score: 2538
=======================================================
```
Note: This benchmark requires an active display on the device. Not all devices may be able to run `glmark2-es2`, so in that case, make a note and move on!
TODO: See [this issue](https://github.com/geerlingguy/sbc-reviews/issues/2) for discussion about a full suite of standardized GPU benchmarks.
## Memory
`tinymembench` results:
<details>
<summary>Click to expand memory benchmark result</summary>
```
tinymembench v0.4.10 (simple benchmark for memory throughput and latency)
==========================================================================
== Memory bandwidth tests ==
== ==
== Note 1: 1MB = 1000000 bytes ==
== Note 2: Results for 'copy' tests show how many bytes can be ==
== copied per second (adding together read and writen ==
== bytes would have provided twice higher numbers) ==
== Note 3: 2-pass copy means that we are using a small temporary buffer ==
== to first fetch data into it, and only then write it to the ==
== destination (source -> L1 cache, L1 cache -> destination) ==
== Note 4: If sample standard deviation exceeds 0.1%, it is shown in ==
== brackets ==
==========================================================================
C copy backwards : 5373.3 MB/s (0.2%)
C copy backwards (32 byte blocks) : 5372.2 MB/s
C copy backwards (64 byte blocks) : 5372.9 MB/s
C copy : 5456.5 MB/s
C copy prefetched (32 bytes step) : 4020.8 MB/s
C copy prefetched (64 bytes step) : 4143.6 MB/s (0.2%)
C 2-pass copy : 5217.0 MB/s (0.1%)
C 2-pass copy prefetched (32 bytes step) : 3174.1 MB/s
C 2-pass copy prefetched (64 bytes step) : 3175.5 MB/s (0.1%)
C fill : 7946.8 MB/s
C fill (shuffle within 16 byte blocks) : 7943.5 MB/s
C fill (shuffle within 32 byte blocks) : 7946.5 MB/s
C fill (shuffle within 64 byte blocks) : 7944.3 MB/s (0.2%)
---
standard memcpy : 8138.6 MB/s
standard memset : 7968.4 MB/s
---
MOVSB copy : 5436.5 MB/s
MOVSD copy : 5275.4 MB/s (2.6%)
SSE2 copy : 4847.0 MB/s
SSE2 nontemporal copy : 7660.0 MB/s (0.8%)
SSE2 copy prefetched (32 bytes step) : 4677.2 MB/s (0.3%)
SSE2 copy prefetched (64 bytes step) : 4690.3 MB/s (0.2%)
SSE2 nontemporal copy prefetched (32 bytes step) : 6329.2 MB/s (0.3%)
SSE2 nontemporal copy prefetched (64 bytes step) : 6597.4 MB/s
SSE2 2-pass copy : 4644.6 MB/s (1.5%)
SSE2 2-pass copy prefetched (32 bytes step) : 3697.0 MB/s (0.7%)
SSE2 2-pass copy prefetched (64 bytes step) : 3767.6 MB/s
SSE2 2-pass nontemporal copy : 2722.4 MB/s (1.2%)
SSE2 fill : 7329.0 MB/s (0.5%)
SSE2 nontemporal fill : 16293.2 MB/s
==========================================================================
== Memory latency test ==
== ==
== Average time is measured for random memory accesses in the buffers ==
== of different sizes. The larger is the buffer, the more significant ==
== are relative contributions of TLB, L1/L2 cache misses and SDRAM ==
== accesses. For extremely large buffer sizes we are expecting to see ==
== page table walk with several requests to SDRAM for almost every ==
== memory access (though 64MiB is not nearly large enough to experience ==
== this effect to its fullest). ==
== ==
== Note 1: All the numbers are representing extra time, which needs to ==
== be added to L1 cache latency. The cycle timings for L1 cache ==
== latency can be usually found in the processor documentation. ==
== Note 2: Dual random read means that we are simultaneously performing ==
== two independent memory accesses at a time. In the case if ==
== the memory subsystem can't handle multiple outstanding ==
== requests, dual random read has the same timings as two ==
== single reads performed one after another. ==
==========================================================================
block size : single random read / dual random read, [MADV_NOHUGEPAGE]
1024 : 0.0 ns / 0.0 ns
2048 : 0.0 ns / 0.0 ns
4096 : 0.0 ns / 0.0 ns
8192 : 0.0 ns / 0.0 ns
16384 : 0.0 ns / 0.0 ns
32768 : 0.0 ns / 0.0 ns
65536 : 2.5 ns / 3.7 ns
131072 : 3.8 ns / 4.7 ns
262144 : 5.1 ns / 6.0 ns
524288 : 6.4 ns / 7.2 ns
1048576 : 7.1 ns / 7.5 ns
2097152 : 8.7 ns / 9.8 ns
4194304 : 14.9 ns / 18.8 ns
8388608 : 34.2 ns / 50.9 ns
16777216 : 89.3 ns / 129.8 ns
33554432 : 125.3 ns / 165.9 ns
67108864 : 145.4 ns / 181.9 ns
block size : single random read / dual random read, [MADV_HUGEPAGE]
1024 : 0.0 ns / 0.0 ns
2048 : 0.0 ns / 0.0 ns
4096 : 0.0 ns / 0.0 ns
8192 : 0.0 ns / 0.0 ns
16384 : 0.0 ns / 0.0 ns
32768 : 0.0 ns / 0.0 ns
65536 : 2.5 ns / 3.7 ns
131072 : 3.8 ns / 4.7 ns
262144 : 4.4 ns / 4.9 ns
524288 : 4.7 ns / 5.0 ns
1048576 : 4.9 ns / 5.0 ns
2097152 : 5.2 ns / 5.3 ns
4194304 : 11.3 ns / 14.4 ns
8388608 : 28.9 ns / 43.7 ns
16777216 : 80.1 ns / 114.8 ns
33554432 : 109.6 ns / 140.2 ns
67108864 : 125.3 ns / 148.9 n
```
</details>
## `sbc-bench` results
https://0x0.st/XO8j.bin
```
* memcpy: 7292.7 MB/s, memchr: 10791.5 MB/s, memset: 7153.0 MB/s
* 16M latency: 145.3 126.3 146.2 126.9 145.9 126.7 119.4 126.5
* 128M latency: 160.6 144.3 162.0 144.5 161.0 171.1 139.2 141.3
* 7-zip MIPS (3 consecutive runs): 7919, 7956, 7971 (7950 avg), single-threaded: 3459
* `aes-256-cbc 891938.02k 1178187.61k 1216253.87k 1227214.51k 1230935.38k 1230744.23k`
* `aes-256-cbc 876402.26k 1132943.79k 1217788.42k 1228350.12k 1230916.27k 1230236.33k`
```
## Phoronix Test Suite
Results from [pi-general-benchmark.sh](https://gist.github.com/geerlingguy/570e13f4f81a40a5395688667b1f79af):
- pts/encode-mp3: 9.461 sec
- pts/x264 4K: 4.43 fps
- pts/x264 1080p: 20.22 fps
- pts/phpbench: 706245
- pts/build-linux-kernel (defconfig): 1018.833 sec