Didn’t check hw accel in OpenCV, Need to find where to update.
Is the bytetrack code pushed in ff-rknn ?
I haven’t gone that far yet. I’m still figuring out how to improve the fps.
Are you using c++ or go?
C++ using rknn_threaded.
I just did a code port of ByteTrack, during that development I found it to not have the accuracy I would desire. There isn’t a tracking method around that gives 100% accuracy.
I found the only rendering that is expensive is YOLO-seg, anything else (bounding boxes) take 4-5-ms to render. On a video that I uses I get the following break down.
| Model | Average Total Time | Inference | Post Processing | Rendering |
|---|---|---|---|---|
| YOLOv5s | 29.6ms | 33.6ms | 1.0ms | 4.4ms |
| YOLOv8s | 44.8ms | 47.5ms | 5.0ms | 4.2ms |
| YOLOv10s | 49.4ms | 57.1ms | 2.9ms | 4.1ms |
| YOLOXs | 42.4ms | 48.7ms | 0.5ms | 5.5ms |
| YOLOv8n-pose | 47.5ms | 54.1ms | 1.0ms | 3.0ms |
| YOLOv5s-seg | 207.5ms | 57.0ms | 107.6ms | 75.9ms |
| YOLOv8s-seg | 232.5ms | 67.9ms | 113.3ms | 73.4ms |
The Inference, Post Processing, and Rendering columns show how processing time is split across the Total Time. These figures are derived from the first run on the benchmark so when totaled together they are slightly higher than the Average Total Time.
The Inference column represents processing on the NPU, Post Processing and Rendering values are performed on the CPU.
|Model|Average Total Time|Inference|Post Processing|Rendering|
|YOLOv5s|29.6ms|33.6ms|1.0ms|4.4ms|
It’s a good starting point. Let us have it as a reference.
My “average inference time” is the sum of your inference and post-processing and is about 20 ms (on average), done in Rock5B. I did not expect yolov8, and yolov10 to be so slow.
to summarize the differences and optimizations that come to my mind.
Using a video stream:
Read a frame and decode it (VPU) -> NV12(?) -> RGB24 -> NPU (parallel?) -> Drawing bounding Box in RGB24 (CPU) -> Drawing RGB24 scene (CPU?)
Using the camera (mipi):
Read a frame -> NV12 -> RGB24 -> NPU -> Rendering the scene NV12 (GPU mali) -> Drawing bounding box (GPU mali)
I will run the final possible optimization in Rock5B, Rock5C, and Rock5C-lite and compare the results.
1 Like
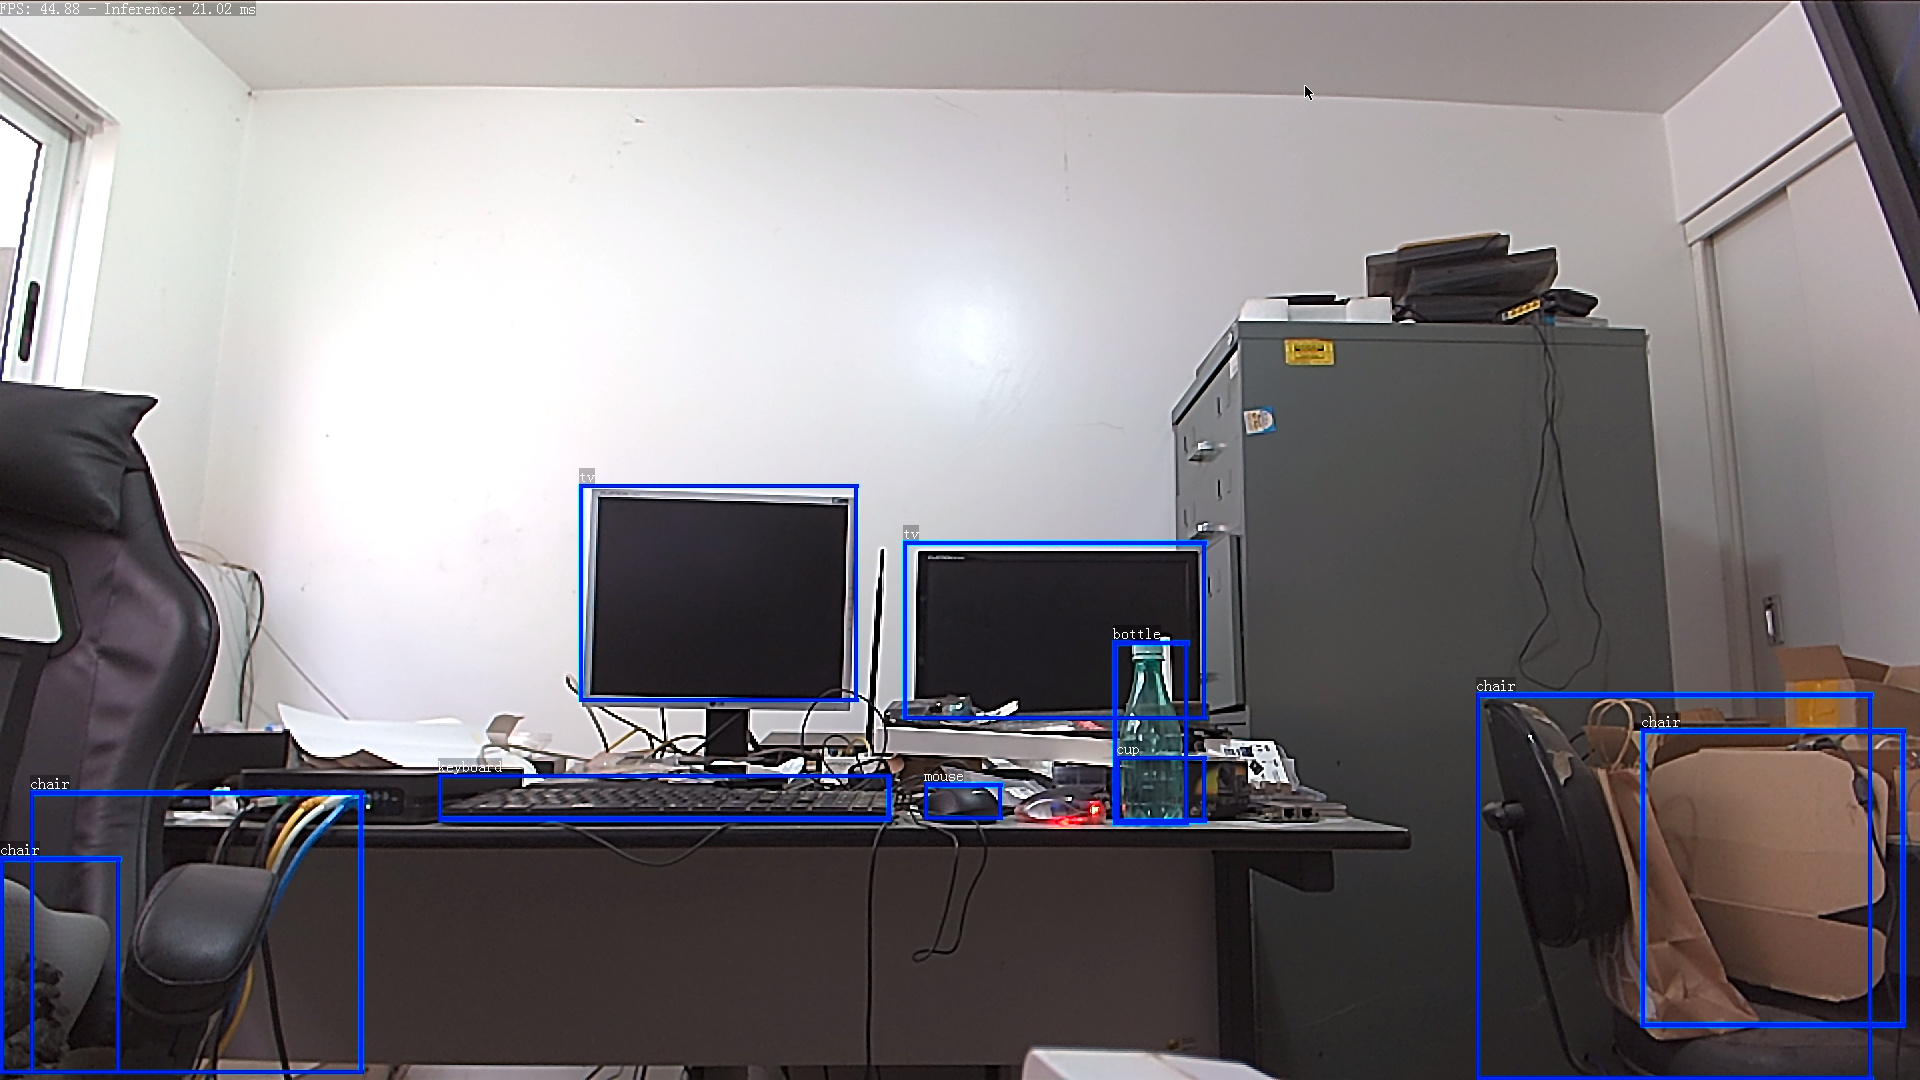
Today i managed to pull 60FPS (imx415@1920x1080) using the above POC on Rock5B and npu cores in parallel, so i think it’s possible to achieve the same with Rock5C (and lite), it should work on Rock5A.
I will try with imx477 and see what i can get…
Rock5B
root@rock5b:/home/rock# cat /sys/kernel/debug/rknpu/load
NPU load: Core0: 35%, Core1: 35%, Core2: 36%,
Rock5C-lite (all cores unlocked and GPU working)
root@rock5c-lite:/home/rock# cat /sys/kernel/debug/rknpu/load
NPU load: Core0: 34%, Core1: 35%, Core2: 35%,
1 Like
Is this threaded or ffmpeg with serial programming?
~44 fps is a multi-threaded app with one NPU core (~75% load).
~60 fps is a multi-threaded app that uses the 3 NPU cores in parallel with the proposed optimization in the previous post. Rendering the scene and bounding boxes with RGB requires a lot of data transfer, instead of RGB, it uses NV12.
The POC uses the main thread for rendering (GPU), a thread for capturing frames, and a thread for each NPU core. The downside of using the GPU is that if you want to encode the final scene, a copy will be involved, increasing CPU usage.
1 Like
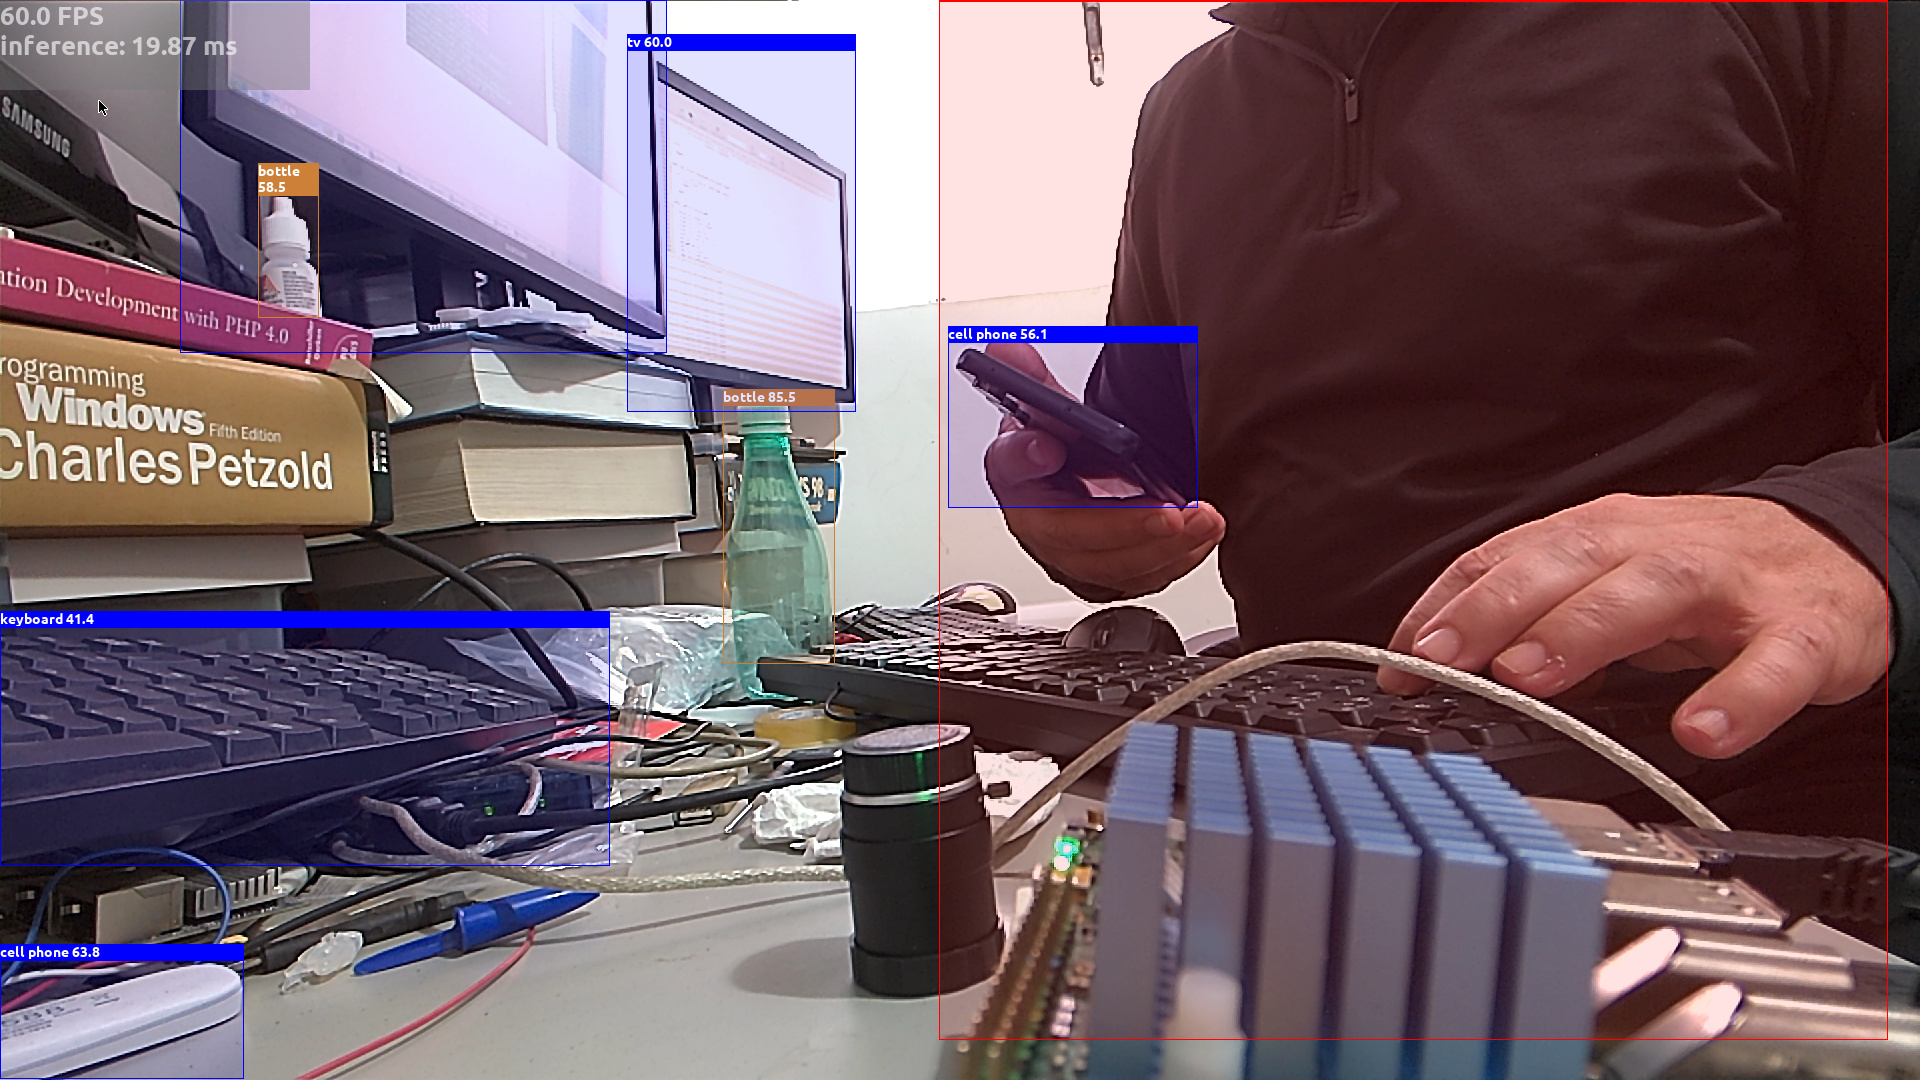
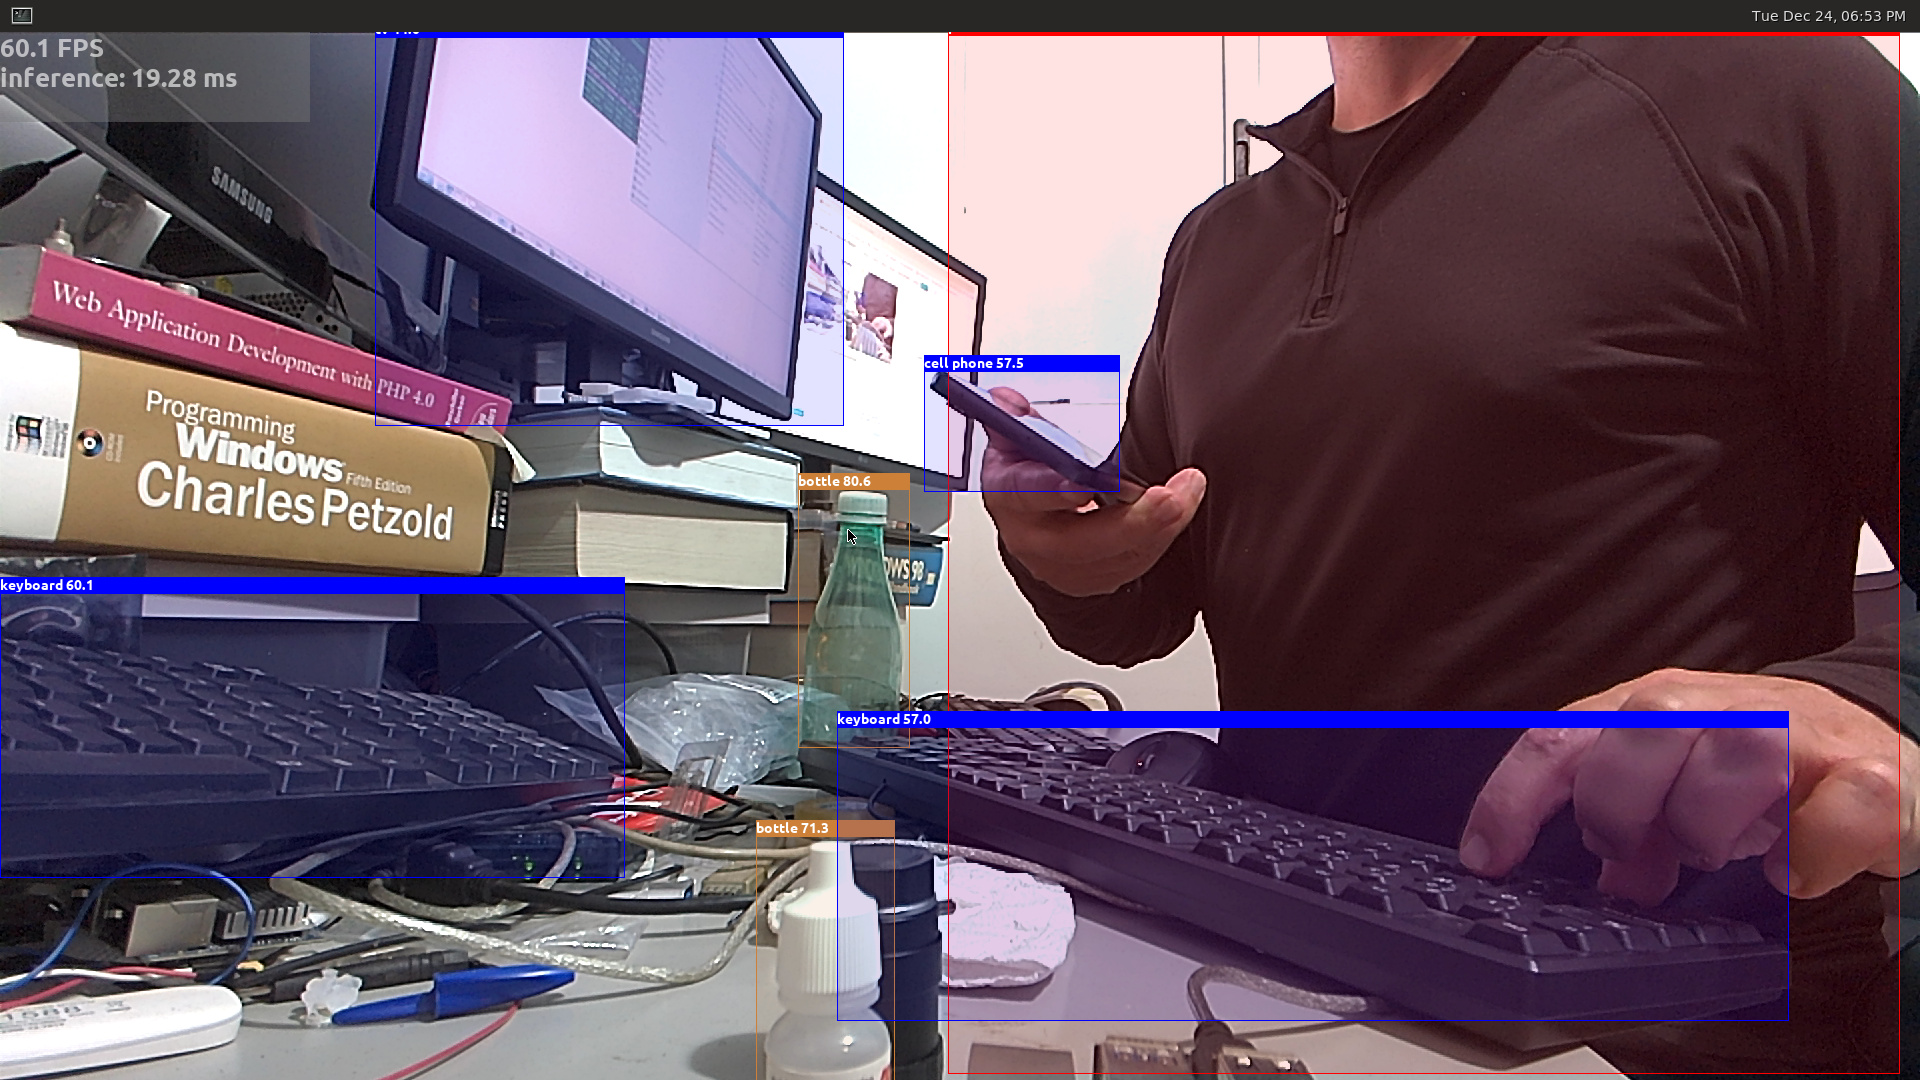
I’ve been playing with NPU + gstreamer and the CPU load is lower than OpenCV or sdl2 as we can see here, but sometimes ksoftirqd/0 (when 60 fps) hits hard in kernel 6.1.x and i don’t have any idea what can trigger it.
gstreamer + NPU on Rock5B 16 GB dram, using NV12 and drawing text and the bouding box directly on NV12 surface.
Can you imagine what the O6 could do???..
CPU load
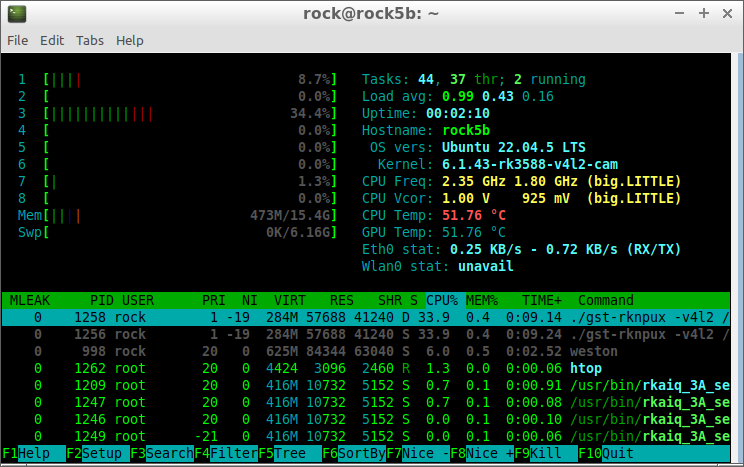
top:
Tasks: 222 total,   1 running, 221 sleeping,   0 stopped,   0 zombie
%Cpu(s):  3.4 us,  1.1 sy,  0.0 ni, 95.4 id,  0.0 wa,  0.0 hi,  0.0 si,  0.0 st
MiB Mem :  15771.2 total,  15054.1 free,    413.9 used,    303.2 buff/cache
MiB Swap:   6308.5 total,   6308.5 free,      0.0 used.  15145.6 avail Mem

    PID USER      PR  NI    VIRT    RES    SHR S  %CPU  %MEM     TIME+ COMMAND
   1560 rock       1 -19  291316  57692  41240 S  33.6   0.4   0:07.06 gst-rknpux
    998 rock      20   0  640328  84344  63040 S   3.0   0.5   0:03.90 weston
    147 root      20   0       0      0      0 I   0.7   0.0   0:00.06 kworker/3:2-pm
   1209 root      20   0  426568  10816   5152 S   0.7   0.1   0:01.38 rkaiq_3A_server
   1577 root      20   0    7504   3364   2616 R   0.7   0.0   0:00.09 top
    138 root      20   0       0      0      0 D   0.3   0.0   0:00.19 kworker/u16:5+even+
    163 root       0 -20       0      0      0 I   0.3   0.0   0:00.34 kworker/u17:0-mali+
    223 root     -51   0       0      0      0 S   0.3   0.0   0:00.33 irq/43-rga3_core0
    999 root      20   0       0      0      0 S   0.3   0.0   0:00.48 mali-gpuq-kthread
   1438 root      20   0       0      0      0 I   0.3   0.0   0:00.04 kworker/u16:1-even+
      1 root      20   0  166104  10356   7488 S   0.0   0.1   0:01.35 systemd
When ksoftirqd/0 kicks in:
Tasks: 257 total,   2 running, 255 sleeping,   0 stopped,   0 zombie
%Cpu(s):  3.3 us,  2.1 sy,  0.0 ni, 83.1 id,  0.0 wa,  0.0 hi, 11.5 si,  0.0 st
MiB Mem :  15771.2 total,  15051.6 free,    414.0 used,    305.6 buff/cache
MiB Swap:   6308.5 total,   6308.5 free,      0.0 used.  15145.6 avail Mem

    PID USER      PR  NI    VIRT    RES    SHR S  %CPU  %MEM     TIME+ COMMAND
     13 root      20   0       0      0      0 R  99.3   0.0   0:39.17 ksoftirqd/0
   1264 rock       1 -19  291308  58140  41252 S  33.1   0.4   0:13.29 gst-rknpux
   1250 rock      20   0  640076  84124  62868 S   3.0   0.5   0:01.40 weston
   1207 root      20   0  426568   9692   4304 S   1.3   0.1   0:00.41 rkaiq_3A_server
   1284 rock      20   0    7520   3188   2596 R   0.7   0.0   0:00.06 top
does ksoftirq reboot the system or segfault? can I check the test?
ksoftirq just indicates pending IRQs are not handled fast enough by the software so they had to switch to polled mode, but this consumes a lot of CPU. This is super frequent on the network at very high packet rates, but for lower speed hardware it might possibly indicate a bug in a driver, though it’s not easy to figure which one.
Yes, there is no system reboot or segfault, just wasting CPU, the board is still running stable, and the network is stable as well. Initially, i thought it was an IMX477 driver issue (Rock 5C) but the same occurred with IMX415 driver (Rock 5B). It was observed while rendering 50 fps (imx477) and 60 fps (imx415), maybe something related to mali blob. It was running 6.1.x.
Instead of rendering it on display, i will push it via ethernet, something like FPV, at least mali will not be involved, but this can take some time.
Or the camera engine (v4l2) can’t cope with such high fps
@avaf is the same code that you have ff-rknn? with these changes?
Single thread, single NPU core (no parallelism): https://github.com/avafinger/ff-rknn
Multi-thread, single NPU core (no parallelism): https://github.com/PuntoMaximo/ff-rknn-sdl2
Neither code has a multi-threaded NPU.
The current ffmpeg converts NV12 to DRM_PRIME internally for encoding (i think)  , thus consuming a bit more CPU.
I could not find a way to do parallelism in gstreamer, if you have, please share.
Can you share build instructions for ff-rknn-sdl2 ?
In my setup, it was something like this (adjust to yours):
LD_LIBRARY_PATH=./lib1.6/ g++ -O3 --permissive -o ff-rknn-sdl2 ff-rknn-sdl2.c SDL_FontCache.c postprocess.cc -D_USE_THREADS_ -D_FILE_OFFSET_BITS=64 -D REENTRANT -I./ -I/usr/include/drm -I/usr/include -I/usr/include/SDL2 -lSDL2 -lSDL2_ttf -lz -lm -lpthread -ldrm -lrockchip_mpp -llzma -lrtmp -lssl -lcrypto -lbz2 -lxml2 -lX11 -lxcb -lXv -lXext -lv4l2 -lrga -lva -lxcb-shm -lxcb-xfixes -lxcb-render -lxcb-shape -lxcb -lXau -lXdmcp -lxcb -lxcb-shape -lXmu -lXext -lXi -lv4l2 -lasound -lpulse -lsndio -lGL -lpulse -lGL -lGLESv2 -lsndio -lfreetype -lvorbis -lvorbisenc -lopus -lrknnrt -lmp3lame
and FFMPEG from here? https://github.com/nyanmisaka/ffmpeg-rockchip
SDL_FontCache.c file is missing in ff-rknn-sdl2